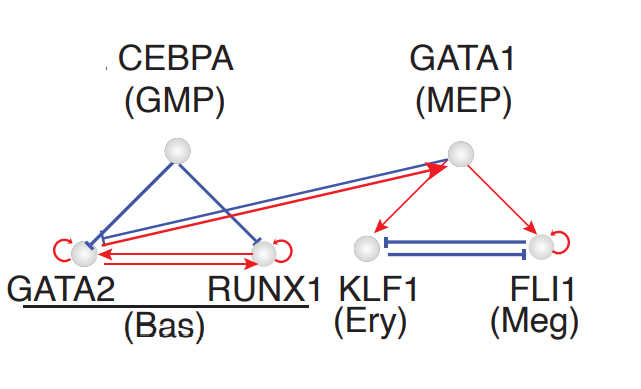
Minimal network for basophil lineage commitment
Early studies reported that basophils are derived from GMPs (Iwasaki et al., 2006; Truong and Ben-David, 2000). Our HSC dataset, however, suggests that they mostly originated from MEP-like cells (with a minor route from GMP-like cells), in line with recent scRNA-seq studies (Drissen et al., 2016; Pellin et al., 2019). To reconcile the discrepancy of two alternative trajectories of the Bas lineage, we leverage RNA differential geometry analyses empowered by dynamo to derive a minimal network model that explains Bas lineage’s dual origins.
Let us first import relevant packages and load the preprocessed HSC scNT-seq dataset that reported in the dynamo Cell paper.
%%capture
import numpy as np
import pandas as pd
import matplotlib.pyplot as plt

import sys
import os

import dynamo as dyn
import seaborn as sns

dyn.dynamo_logger.main_silence()
adata_labeling = dyn.sample_data.hematopoiesis()
Regulatory network governing the Bas lineage’s dual origins
In order to reveal the minimal network of Bas lineage’s dual origin, we start with identifying putative drivers of Meg/Ery versu Bas lineage bifurcation. We perform switch gene-pair analyses to identify gene pairs with antagonistic interactions for genes responsible for the Ery and Bas lineage bifurcations. This is done by selecting cells near the regions of the bifurcation point, followed by ranking switch gene pairs. Something like the following:
# select cells near the bifurcation to get bif_adata
dyn.vf.rank_jacobian_genes(bif_adata, groups='cell_type', mode='switch')
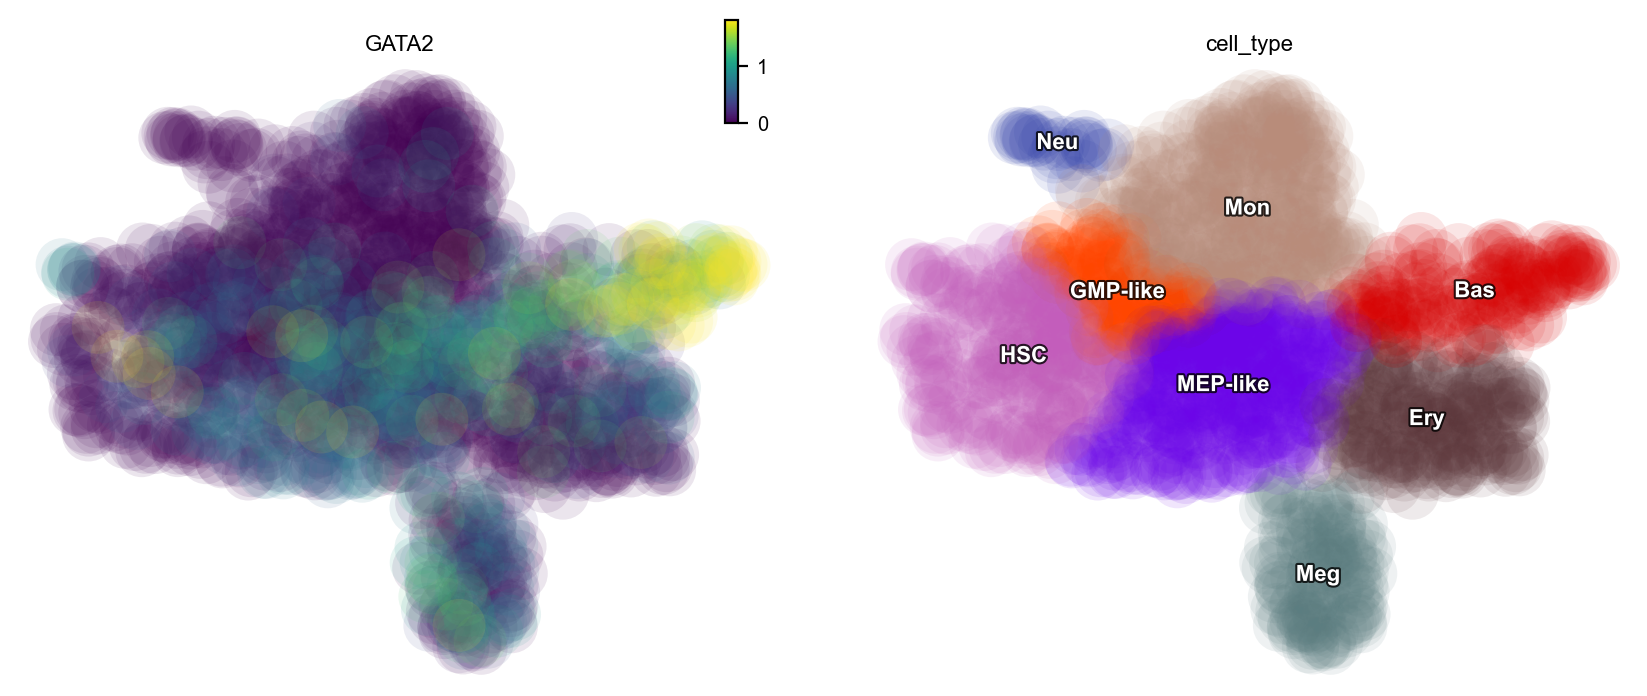
Notably, the GATA2-PLEK pair ranked first (see ranking table). Similar to PLEK’s exclusivity in Meg, the expression of GATA2 is specifically high in basophils, as shown below:
dyn.pl.scatters(adata_labeling, color=["GATA2", "cell_type"])
Switch pair ranking analyses also prioritized the involvement of CEBPA and RUNX1, previously reported in (Guo et al., 2017), as well as GATA1, the master regulator of the GMP lineage. Next, we will perform Jacobian analyses to reveal interactions between these genes.
selected_genes = ["GATA2", "CEBPA", "RUNX1"]

dyn.vf.jacobian(adata_labeling, regulators=selected_genes, effectors=selected_genes)
dyn.pl.jacobian(
    adata_labeling,
    regulators="CEBPA",
    effectors=["RUNX1", "GATA2"],
    basis="umap"
)
Transforming subset Jacobian: 100%|██████████| 1947/1947 [00:00<00:00, 113006.61it/s]
/Users/random/dynamo-release/dynamo/plot/vector_calculus.py:658: UserWarning: This figure includes Axes that are not compatible with tight_layout, so results might be incorrect.
  plt.tight_layout()
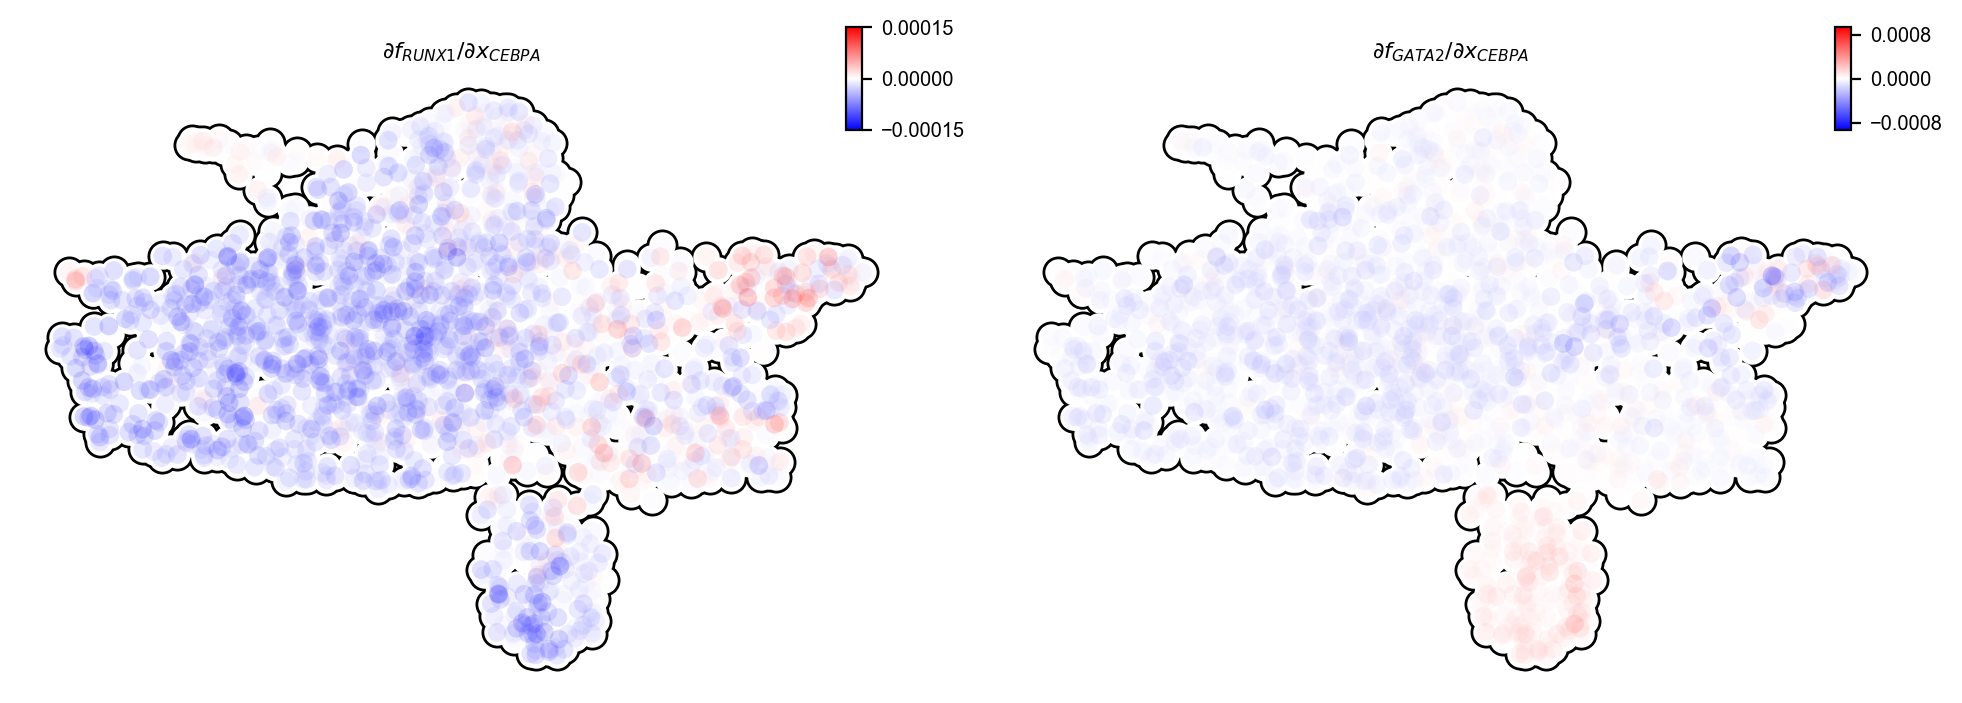
From the above Jacobian analyses, it is clear that CEBPA represses both RUNX1 and GATA2。
Next we will also investigate the interactions between RUNX1 and GATA2:
dyn.pl.jacobian(
    adata_labeling,
    effectors=["RUNX1", "GATA2"],
    basis="umap"
)
/Users/random/dynamo-release/dynamo/plot/vector_calculus.py:658: UserWarning: This figure includes Axes that are not compatible with tight_layout, so results might be incorrect.
  plt.tight_layout()
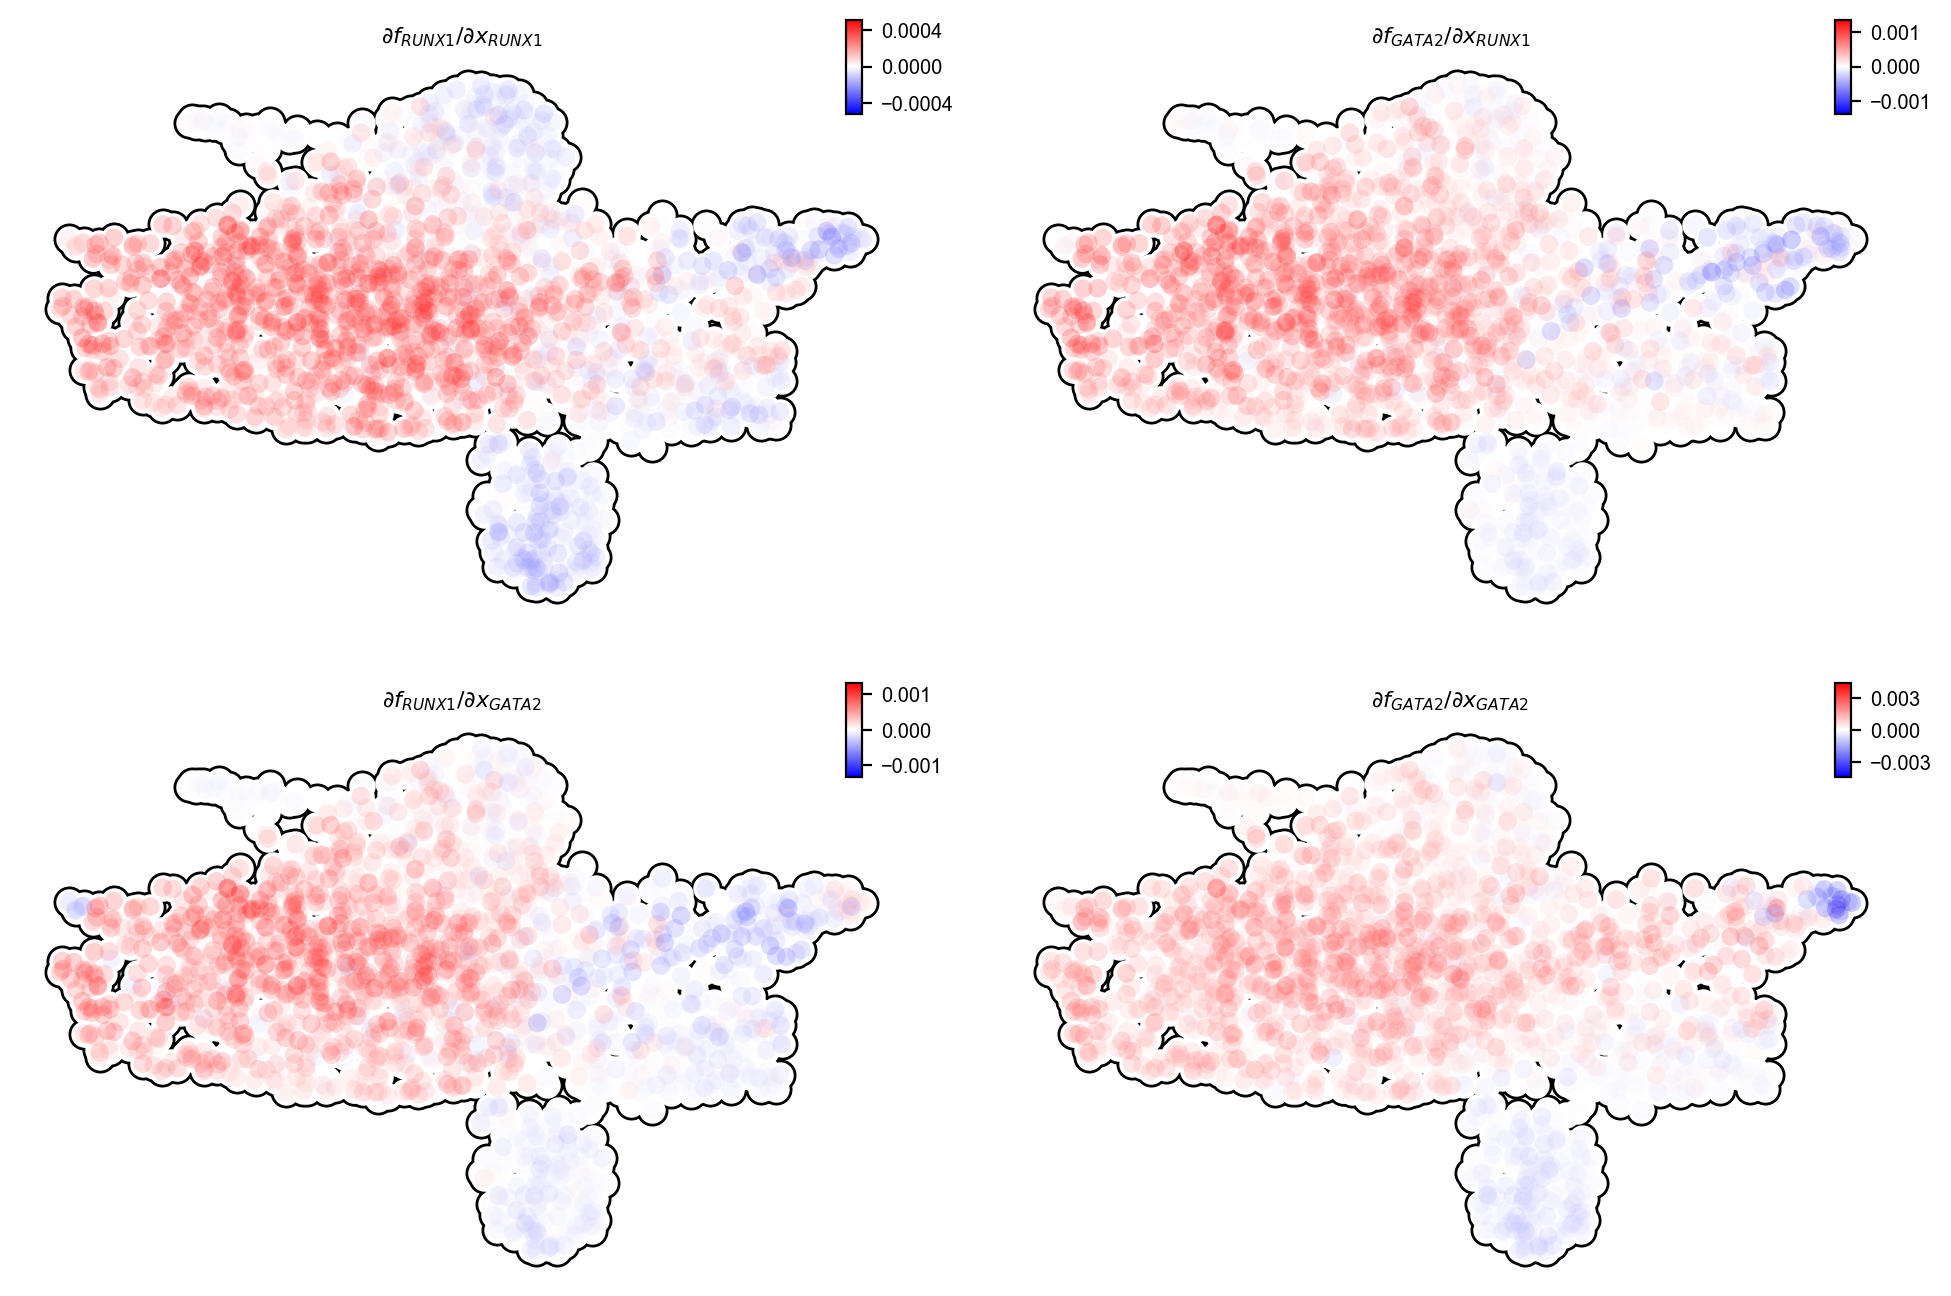
It turns out that RUNX1 and GATA2 form a community that has both mutual activation and self-activation.
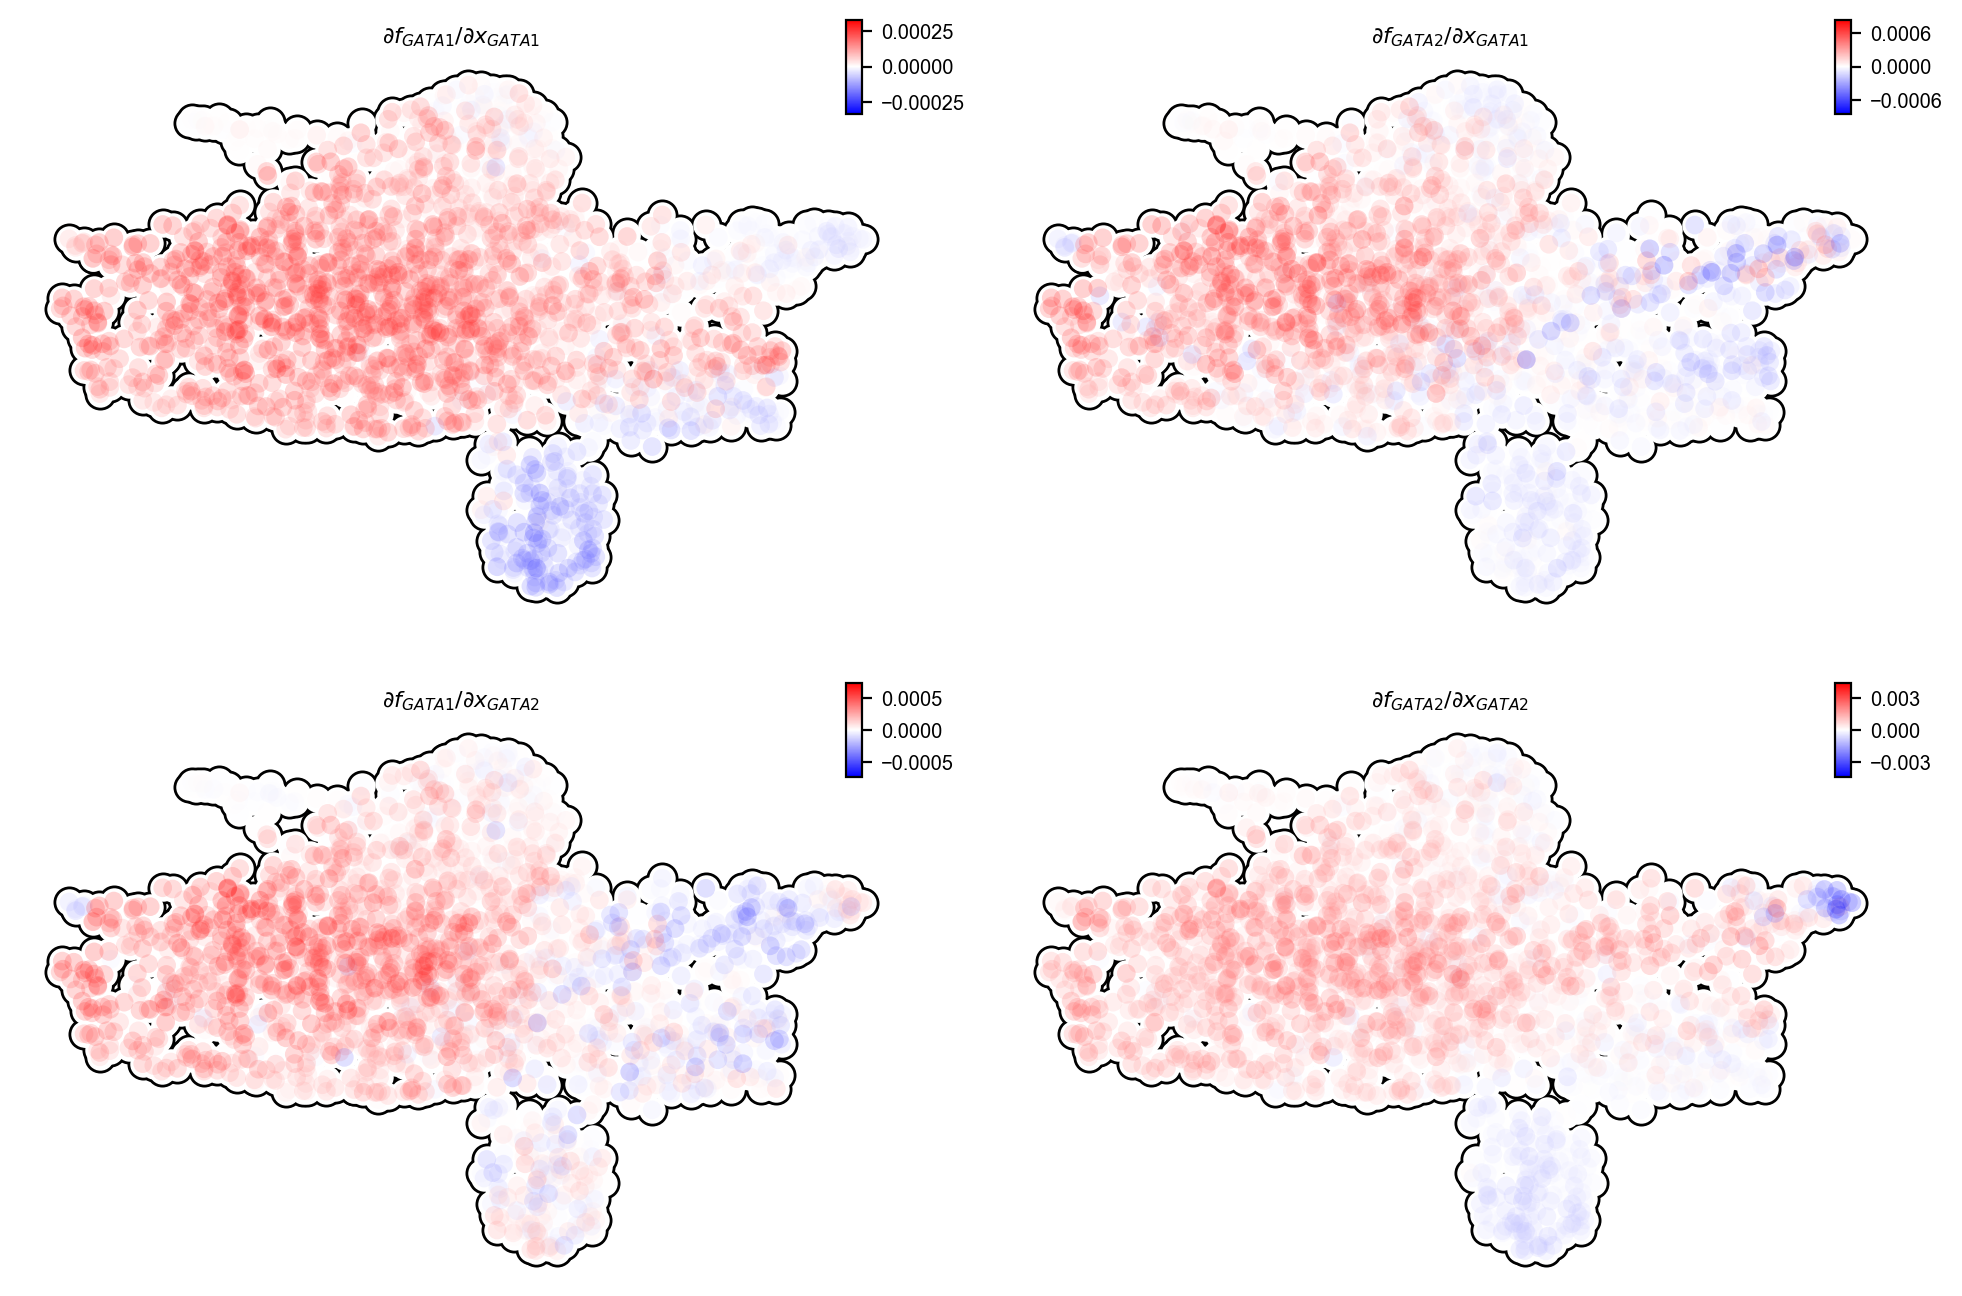
Subsequent Jacobian analyses also confirm the known repression from GATA1 to GATA2, activation from GATA2 back to GATA1, as reported and modeld in Jan Krumsiek, 2011.
dyn.vf.jacobian(
    adata_labeling,
    effectors=["GATA1", "GATA2"],
)

dyn.pl.jacobian(
    adata_labeling,
    effectors=["GATA1", "GATA2"],
    basis="umap"
)
Transforming subset Jacobian: 100%|██████████| 1947/1947 [00:00<00:00, 125710.96it/s]
/Users/random/dynamo-release/dynamo/plot/vector_calculus.py:658: UserWarning: This figure includes Axes that are not compatible with tight_layout, so results might be incorrect.
  plt.tight_layout()
A minimal network governing GMP vs. Bas origin of Bas lineage