

scEU-seq organoid
This tutorial uses the intestine organoid data from Battich, et al (2020). This tutorial is the second one of the two tutorials for demonstrating how dynamo can use used to analyze the scEU-seq data. Please refer the cell cycle tutorial for details on how to analyze the cell cycle dataset.
import warnings
warnings.filterwarnings('ignore')

import dynamo as dyn
import anndata
import pandas as pd
import numpy as np
import scipy.sparse

from anndata import AnnData
from scipy.sparse import csr_matrix

# dyn.get_all_dependencies_version()
Load data
organoid = dyn.sample_data.scEU_seq_organoid()
|-----> Downloading scEU_seq data
|-----> Downloading data to ./data/organoid.h5ad
organoid
AnnData object with n_obs × n_vars = 3831 × 9157
    obs: 'well_id', 'batch_id', 'treatment_id', 'log10_gfp', 'rotated_umap1', 'rotated_umap2', 'som_cluster_id', 'monocle_branch_id', 'monocle_pseudotime', 'exp_type', 'time'
    var: 'ID', 'NAME'
    layers: 'sl', 'su', 'ul', 'uu'
# mapping:
cell_mapper = {
    '1': 'Enterocytes',
    '2': 'Enterocytes',
    '3': 'Enteroendocrine',
    '4': 'Enteroendocrine progenitor',
    '5': 'Tuft cells',
    '6': 'TA cells',
    '7': 'TA cells',
    '8': 'Stem cells',
    '9': 'Paneth cells',
    '10': 'Goblet cells',
    '11': 'Stem cells',
 }

organoid.obs['cell_type'] = organoid.obs.som_cluster_id.map(cell_mapper).astype('str')
typical dynamo analysis workflow
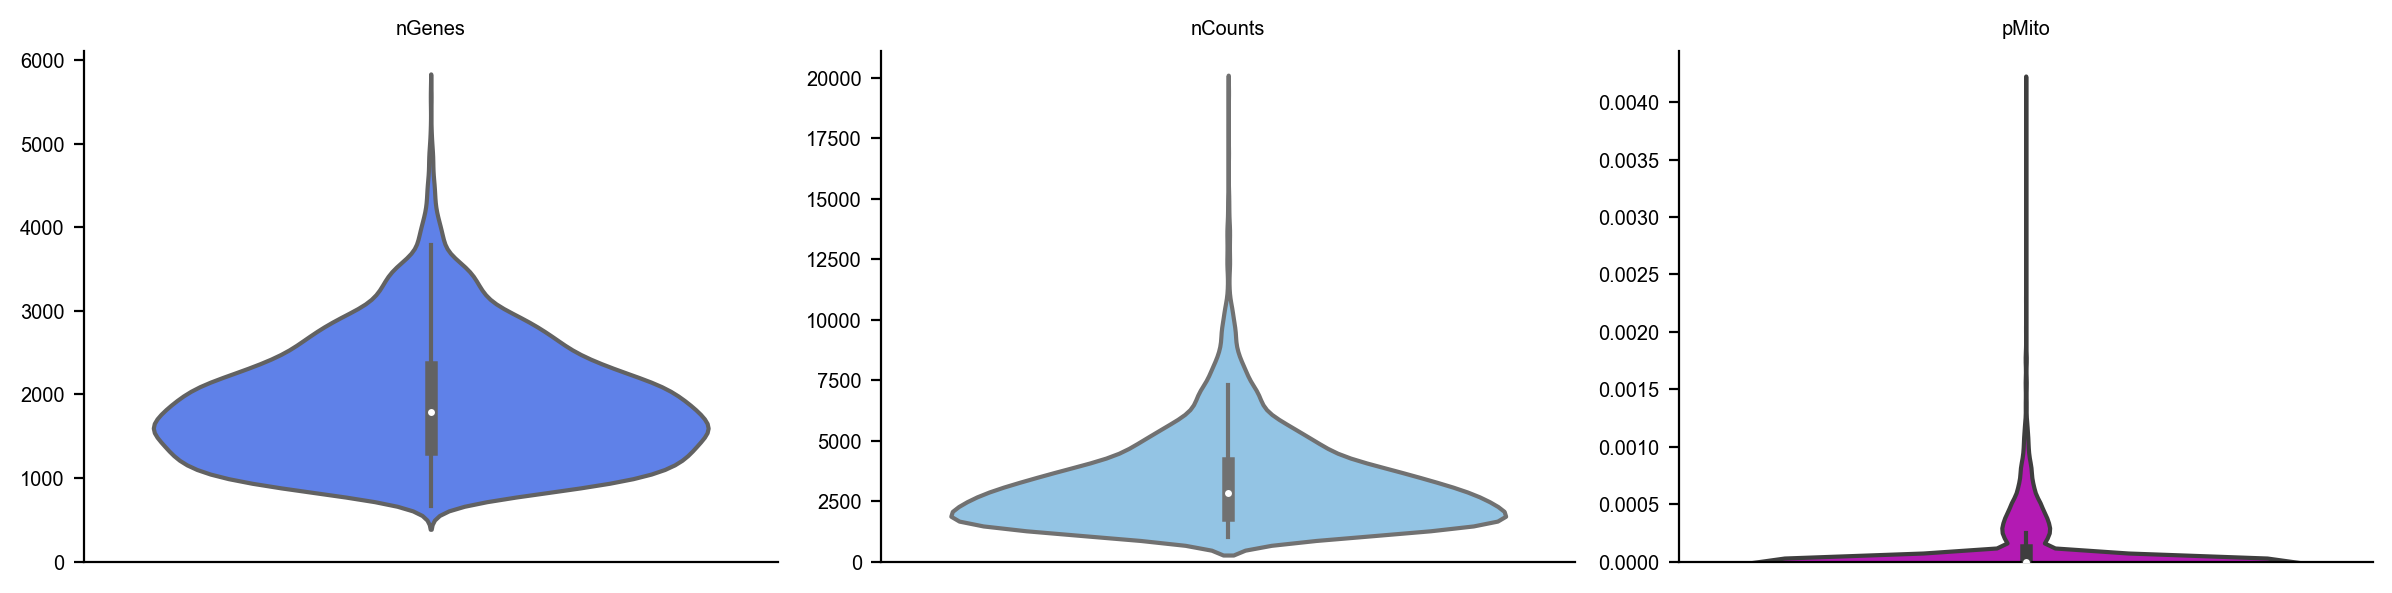
dyn.pl.basic_stats(organoid)
organoid
AnnData object with n_obs × n_vars = 3831 × 9157
    obs: 'well_id', 'batch_id', 'treatment_id', 'log10_gfp', 'rotated_umap1', 'rotated_umap2', 'som_cluster_id', 'monocle_branch_id', 'monocle_pseudotime', 'exp_type', 'time', 'cell_type', 'nGenes', 'nCounts', 'pMito'
    var: 'ID', 'NAME', 'nCells', 'nCounts'
    layers: 'sl', 'su', 'ul', 'uu'
organoid.obs
| well_id | batch_id | treatment_id | log10_gfp | rotated_umap1 | rotated_umap2 | som_cluster_id | monocle_branch_id | monocle_pseudotime | exp_type | time | cell_type | nGenes | nCounts | pMito | |
|---|---|---|---|---|---|---|---|---|---|---|---|---|---|---|---|
| 1 | 14 | 01 | Pulse_120 | 12.8929281522 | 23.0662174225 | -3.47039175034 | 6 | 2 | 6.08688834859 | Pulse | 120 | TA cells | 1054 | 1426.0 | 0.0 |
| 2 | 15 | 01 | Pulse_120 | 5.85486775252 | 25.710735321 | -1.31835341454 | 2 | 2 | 9.14740876358 | Pulse | 120 | Enterocytes | 1900 | 3712.0 | 0.0 |
| 3 | 16 | 01 | Pulse_120 | 7.45690471634 | 26.7709560394 | -1.06682777405 | 2 | 2 | 9.69134627386 | Pulse | 120 | Enterocytes | 2547 | 6969.0 | 0.0 |
| 4 | 17 | 01 | Pulse_120 | 94.2814535609 | 21.2927913666 | 0.0159659013152 | 11 | 2 | 4.2635104705 | Pulse | 120 | Stem cells | 1004 | 1263.0 | 0.0 |
| 5 | 21 | 01 | Pulse_120 | 47.1412266395 | 19.9096126556 | 0.884054124355 | 11 | 1 | 2.62248093423 | Pulse | 120 | Stem cells | 927 | 1144.0 | 0.0 |
| ... | ... | ... | ... | ... | ... | ... | ... | ... | ... | ... | ... | ... | ... | ... | ... |
| 3827 | 378 | 12 | Pulse_120 | 32.496816667 | 20.7663478851 | -3.72811675072 | 8 | 3 | 7.32939908351 | Pulse | 120 | Stem cells | 2268 | 3918.0 | 0.0 |
| 3828 | 379 | 12 | Pulse_120 | 78.1198193763 | 20.1073760986 | -2.65023303032 | 8 | 3 | 5.10436147713 | Pulse | 120 | Stem cells | 2131 | 3619.0 | 0.0 |
| 3829 | 380 | 12 | Pulse_120 | 53.249846399 | 20.1618804932 | -3.83158016205 | 8 | 3 | 6.43742448317 | Pulse | 120 | Stem cells | 2141 | 3603.0 | 0.0 |
| 3830 | 381 | 12 | Pulse_dmso | 16.7070737849 | 15.4272613525 | -2.15779066086 | 10 | 1 | 0.657880511889 | Pulse | dmso | Goblet cells | 1158 | 1683.0 | 0.0 |
| 3831 | 383 | 12 | Pulse_dmso | 93.3716092195 | 21.5953540802 | -3.90664196014 | 6 | 2 | 4.81727202212 | Pulse | dmso | TA cells | 1374 | 1838.0 | 0.0 |
3831 rows × 15 columns
organoid.obs.groupby(['exp_type', 'time']).agg('count')
| well_id | batch_id | treatment_id | log10_gfp | rotated_umap1 | rotated_umap2 | som_cluster_id | monocle_branch_id | monocle_pseudotime | cell_type | nGenes | nCounts | pMito | ||
|---|---|---|---|---|---|---|---|---|---|---|---|---|---|---|
| exp_type | time | |||||||||||||
| Chase | 0 | 660 | 660 | 660 | 660 | 660 | 660 | 660 | 660 | 660 | 660 | 660 | 660 | 660 |
| 45 | 821 | 821 | 821 | 821 | 821 | 821 | 821 | 821 | 821 | 821 | 821 | 821 | 821 | |
| 120 | 0 | 0 | 0 | 0 | 0 | 0 | 0 | 0 | 0 | 0 | 0 | 0 | 0 | |
| 360 | 646 | 646 | 646 | 646 | 646 | 646 | 646 | 646 | 646 | 646 | 646 | 646 | 646 | |
| dmso | 0 | 0 | 0 | 0 | 0 | 0 | 0 | 0 | 0 | 0 | 0 | 0 | 0 | |
| Pulse | 0 | 0 | 0 | 0 | 0 | 0 | 0 | 0 | 0 | 0 | 0 | 0 | 0 | 0 |
| 45 | 0 | 0 | 0 | 0 | 0 | 0 | 0 | 0 | 0 | 0 | 0 | 0 | 0 | |
| 120 | 1373 | 1373 | 1373 | 1373 | 1373 | 1373 | 1373 | 1373 | 1373 | 1373 | 1373 | 1373 | 1373 | |
| 360 | 0 | 0 | 0 | 0 | 0 | 0 | 0 | 0 | 0 | 0 | 0 | 0 | 0 | |
| dmso | 331 | 331 | 331 | 331 | 331 | 331 | 331 | 331 | 331 | 331 | 331 | 331 | 331 |
adata = organoid.copy()
adata.obs.time = adata.obs.time.astype('str')
adata.obs.loc[adata.obs['time'] == 'dmso', 'time'] = -1
adata.obs['time'] = adata.obs['time'].astype(float)
adata = adata[adata.obs.time != -1, :]
adata = adata[adata.obs.exp_type == 'Pulse', :]
adata.layers['new'], adata.layers['total'] = adata.layers['ul'] + adata.layers['sl'], adata.layers['su'] + adata.layers['sl'] + adata.layers['uu'] + adata.layers['ul']
del adata.layers['uu'], adata.layers['ul'], adata.layers['su'], adata.layers['sl']
dyn.pp.recipe_monocle(adata, n_top_genes=1000, total_layers=False)
# preprocessor = dyn.pp.Preprocessor(cell_cycle_score_enable=True)
# preprocessor.config_monocle_recipe(adata, n_top_genes=1000)
# preprocessor.preprocess_adata_monocle(adata)
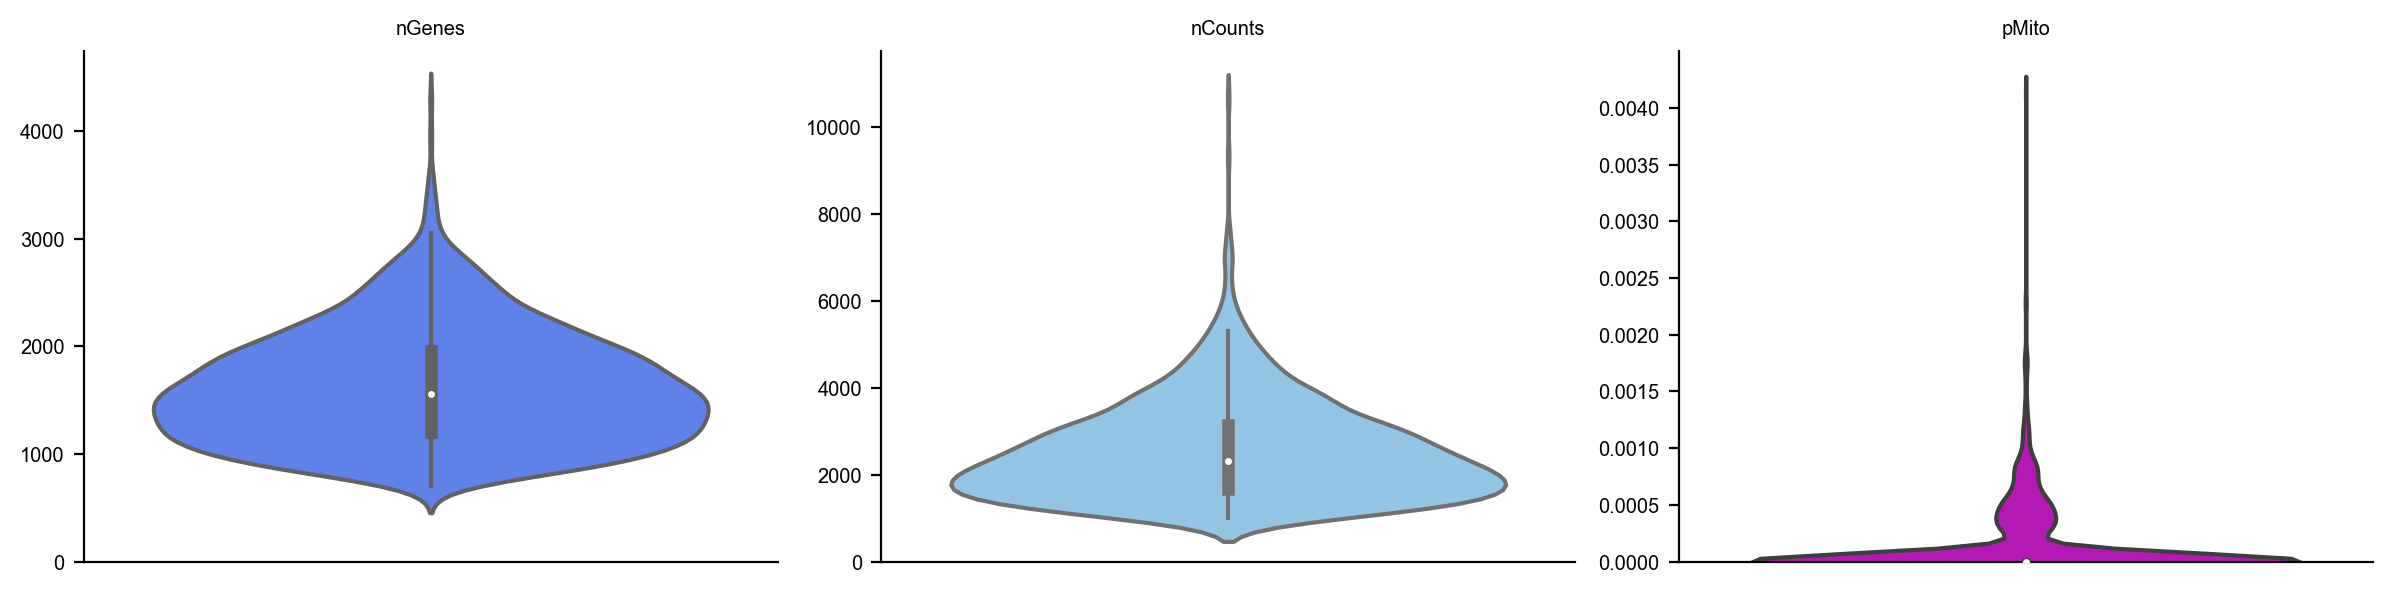
dyn.pl.basic_stats(adata)
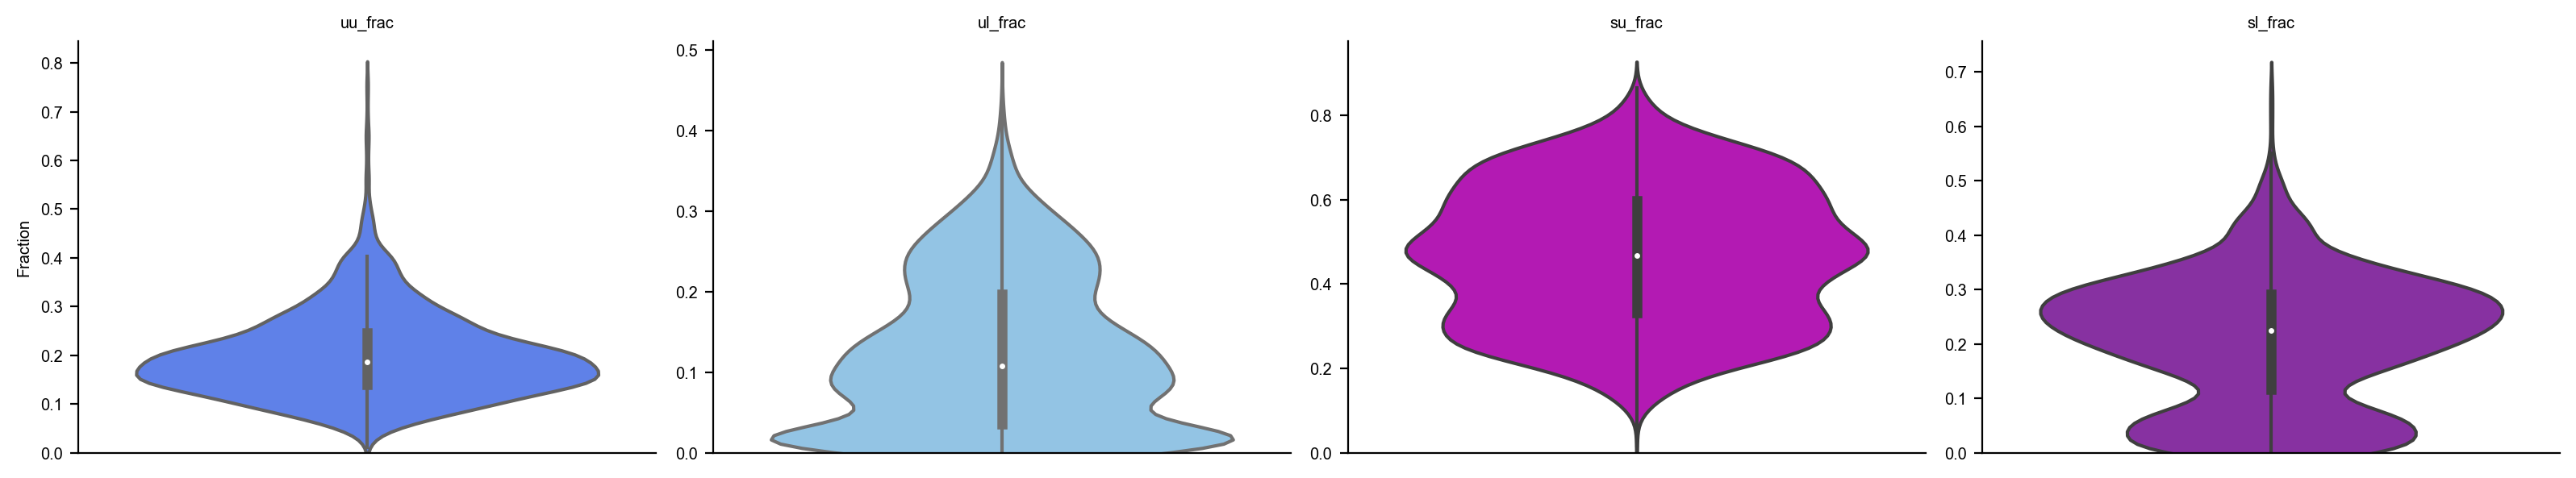
dyn.pl.show_fraction(organoid)
|-----? dynamo.preprocessing.deprecated is deprecated.
|-----> recipe_monocle_keep_filtered_cells_key is None. Using default value from DynamoAdataConfig: recipe_monocle_keep_filtered_cells_key=True
|-----> recipe_monocle_keep_filtered_genes_key is None. Using default value from DynamoAdataConfig: recipe_monocle_keep_filtered_genes_key=True
|-----> recipe_monocle_keep_raw_layers_key is None. Using default value from DynamoAdataConfig: recipe_monocle_keep_raw_layers_key=True
|-----> apply Monocole recipe to adata...
|-----> ensure all cell and variable names unique.
|-----> ensure all data in different layers in csr sparse matrix format.
|-----> ensure all labeling data properly collapased
|-----?
When analyzing labeling based scRNA-seq without providing tkey, dynamo will try to use
 time as the key for labeling time. Please correct this via supplying the correct tkey
if needed.
|-----> detected experiment type: one-shot
|-----? Looks like you are using minutes as the time unit. For the purpose of numeric stability, we recommend using hour as the time unit.
|-----> filtering cells...
|-----> 1373 cells passed basic filters.
|-----> filtering gene...
|-----> 8342 genes passed basic filters.
|-----> calculating size factor...
|-----> selecting genes in layer: X, sort method: SVR...
|-----> size factor normalizing the data, followed by log1p transformation.
|-----> Set <adata.X> to normalized data
|-----> applying PCA ...
|-----> <insert> X_pca to obsm in AnnData Object.
|-----> cell cycle scoring...
|-----> computing cell phase...
|-----> [Cell Phase Estimation] completed [46.1857s]
|-----> [Cell Cycle Scores Estimation] completed [0.0625s]
|-----> [recipe_monocle preprocess] completed [2.0161s]
adata.obs.time = adata.obs.time/60
adata.obs.time  = adata.obs.time.astype('float')
dyn.tl.dynamics(adata, model='deterministic', tkey='time', assumption_mRNA='ss')

dyn.tl.reduceDimension(adata)
|-----> dynamics_del_2nd_moments_key is None. Using default value from DynamoAdataConfig: dynamics_del_2nd_moments_key=False
|-----------> removing existing M layers:[]...
|-----------> making adata smooth...
|-----> calculating first/second moments...
|-----> [moments calculation] completed [6.6967s]
|-----? Your adata only has labeling data, but NTR_vel is set to be False. Dynamo will reset it to True to enable this analysis.
estimating gamma: 100%|█████████████████████| 1000/1000 [00:10<00:00, 91.98it/s]
|-----> retrieve data for non-linear dimension reduction...
|-----> [UMAP] using X_pca with n_pca_components = 30
|-----> <insert> X_umap to obsm in AnnData Object.
|-----> [UMAP] completed [7.4000s]
dyn.tl.cell_velocities(adata, ekey='M_t', vkey='velocity_T', enforce=True)
|-----> incomplete neighbor graph info detected: connectivities and distances do not exist in adata.obsp, indices not in adata.uns.neighbors.
|-----> Neighbor graph is broken, recomputing....
|-----> Start computing neighbor graph...
|-----------> X_data is None, fetching or recomputing...
|-----> fetching X data from layer:None, basis:pca
|-----> method arg is None, choosing methods automatically...
|-----------> method ball_tree selected
|-----> 0 genes are removed because of nan velocity values.
|-----> [calculating transition matrix via pearson kernel with sqrt transform.] in progress: 100.0000%|-----> [calculating transition matrix via pearson kernel with sqrt transform.] completed [2.8198s]
|-----> [projecting velocity vector to low dimensional embedding] in progress: 100.0000%|-----> [projecting velocity vector to low dimensional embedding] completed [0.2473s]
AnnData object with n_obs × n_vars = 1373 × 9157
    obs: 'well_id', 'batch_id', 'treatment_id', 'log10_gfp', 'rotated_umap1', 'rotated_umap2', 'som_cluster_id', 'monocle_branch_id', 'monocle_pseudotime', 'exp_type', 'time', 'cell_type', 'nGenes', 'nCounts', 'pMito', 'pass_basic_filter', 'total_Size_Factor', 'initial_total_cell_size', 'Size_Factor', 'initial_cell_size', 'new_Size_Factor', 'initial_new_cell_size', 'ntr', 'cell_cycle_phase'
    var: 'ID', 'NAME', 'nCells', 'nCounts', 'pass_basic_filter', 'log_m', 'score', 'log_cv', 'frac', 'use_for_pca', 'ntr', 'alpha', 'beta', 'gamma', 'half_life', 'alpha_b', 'alpha_r2', 'gamma_b', 'gamma_r2', 'gamma_logLL', 'delta_b', 'delta_r2', 'bs', 'bf', 'uu0', 'ul0', 'su0', 'sl0', 'U0', 'S0', 'total0', 'beta_k', 'gamma_k', 'use_for_dynamics', 'use_for_transition'
    uns: 'pp', 'velocyto_SVR', 'PCs', 'explained_variance_ratio_', 'pca_mean', 'pca_fit', 'feature_selection', 'cell_phase_genes', 'dynamics', 'neighbors', 'umap_fit', 'grid_velocity_umap'
    obsm: 'X_pca', 'X', 'cell_cycle_scores', 'X_umap', 'velocity_umap'
    varm: 'alpha'
    layers: 'new', 'total', 'X_total', 'X_new', 'M_t', 'M_tt', 'M_n', 'M_tn', 'M_nn', 'velocity_N', 'velocity_T'
    obsp: 'moments_con', 'distances', 'connectivities', 'pearson_transition_matrix'
adata.obsm['X_umap_ori'] = adata.obs.loc[:, ['rotated_umap1', 'rotated_umap2']].values.astype(float)
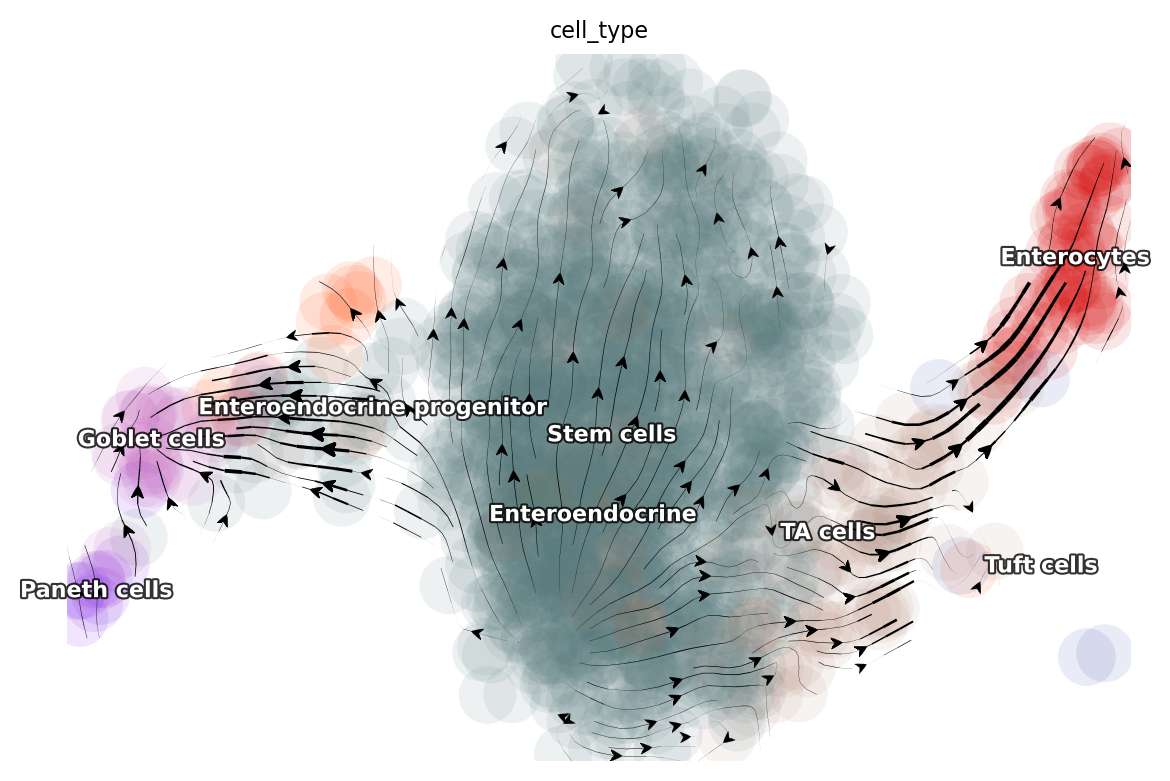
Visualize time-resolved vector flow learned with dynamo
dyn.tl.cell_velocities(adata, basis='umap_ori')

dyn.pl.streamline_plot(adata, color='cell_type', basis='umap_ori')
|-----> 0 genes are removed because of nan velocity values.
Using existing pearson_transition_matrix found in .obsp.
|-----> [projecting velocity vector to low dimensional embedding] in progress: 100.0000%|-----> [projecting velocity vector to low dimensional embedding] completed [0.2389s]
|-----------> plotting with basis key=X_umap_ori
|-----------> skip filtering cell_type by stack threshold when stacking color because it is not a numeric type
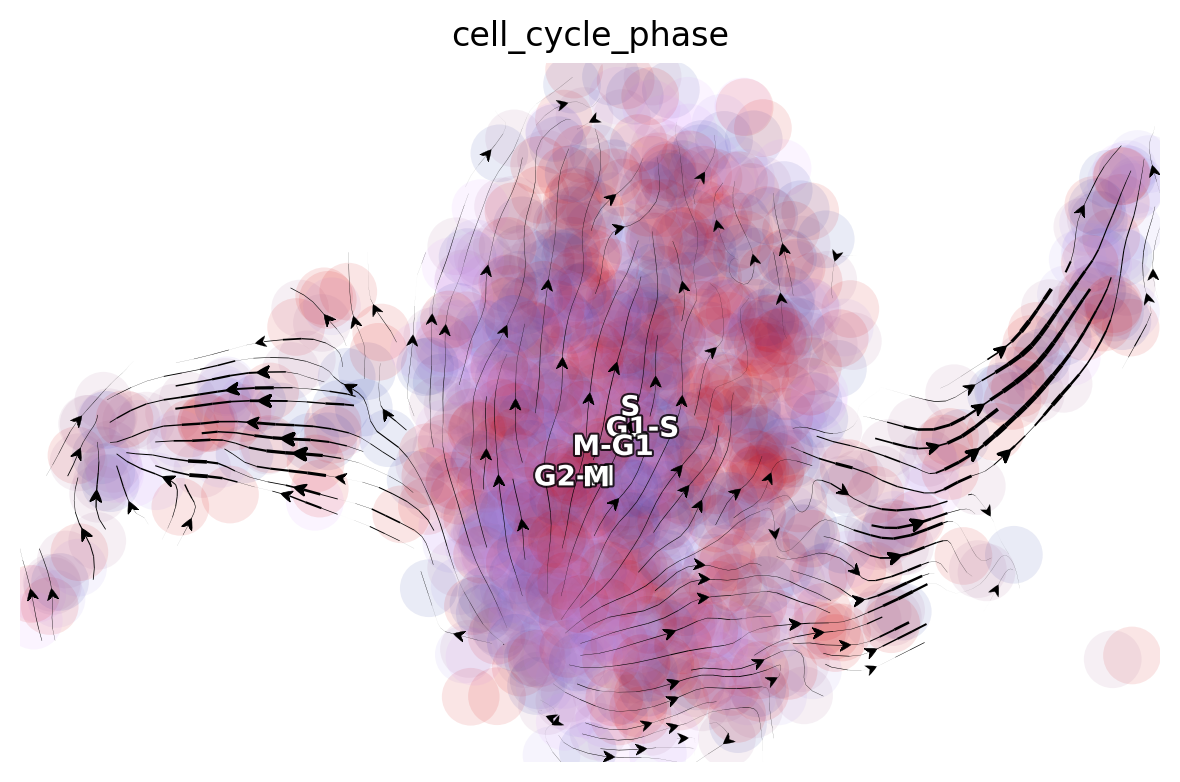
dyn.pl.streamline_plot(adata, color='cell_cycle_phase', basis='umap_ori')
|-----------> plotting with basis key=X_umap_ori
|-----------> skip filtering cell_cycle_phase by stack threshold when stacking color because it is not a numeric type
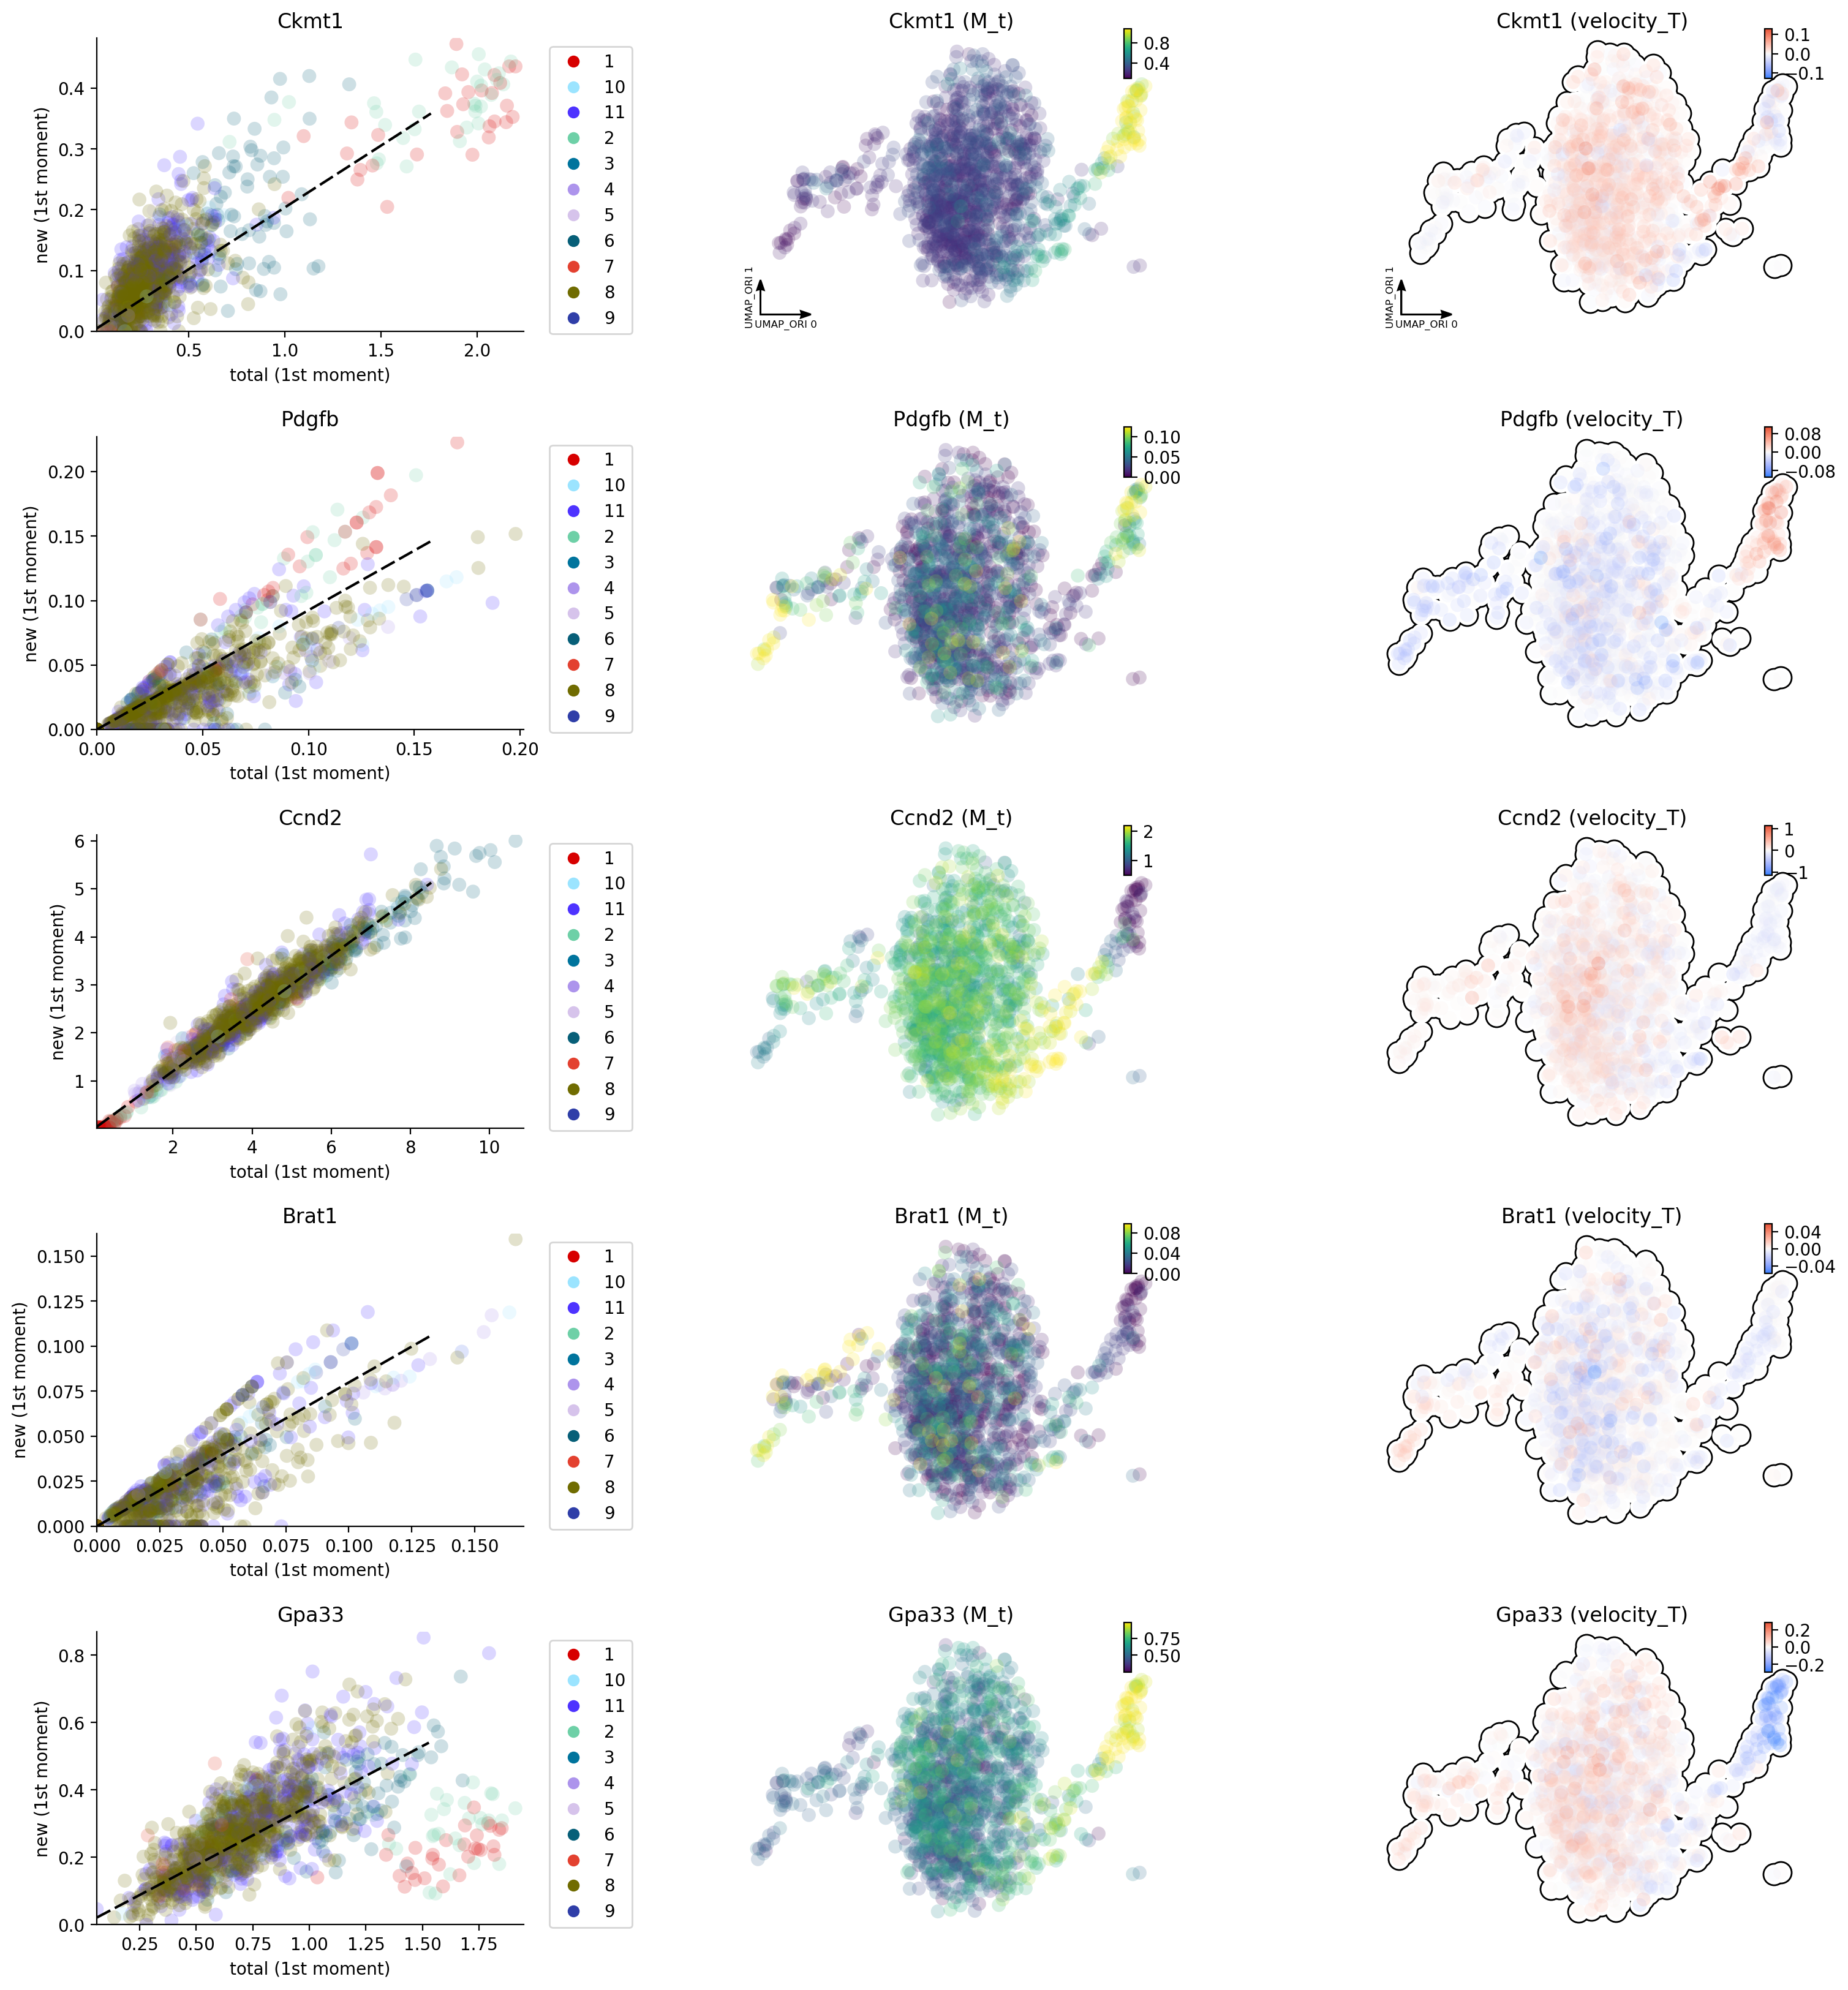
adata.var_names[adata.var.use_for_transition][:5]
Index(['Cdc45', 'Brat1', 'Ccnd2', 'Ckmt1', 'Pdgfb'], dtype='object')
dyn.pl.phase_portraits(adata, genes=['Brat1', 'Ccnd2', 'Ckmt1', 'Pdgfb', 'Gpa33'],
                       color='som_cluster_id', basis='umap_ori')
Animate intestine organoid differentiation
dyn.vf.VectorField(adata, basis='umap_ori')
|-----> VectorField reconstruction begins...
|-----> Retrieve X and V based on basis: UMAP_ORI.
        Vector field will be learned in the UMAP_ORI space.
|-----> Generating high dimensional grids and convert into a row matrix.
|-----> Learning vector field with method: sparsevfc.
|-----> [SparseVFC] begins...
|-----> Sampling control points based on data velocity magnitude...
|-----> [SparseVFC] completed [0.0925s]
|-----> [VectorField] completed [0.1209s]
progenitor = adata.obs_names[adata.obs.cell_type == 'Stem cells']
len(progenitor)
1146
np.random.seed(19491001)

from matplotlib import animation
info_genes = adata.var_names[adata.var.use_for_transition]
dyn.pd.fate(adata, basis='umap_ori', init_cells=progenitor[:100], interpolation_num=100,  direction='forward',
   inverse_transform=False, average=False)
integration with ivp solver: 100%|████████████| 100/100 [00:05<00:00, 18.41it/s]
uniformly sampling points along a trajectory: 100%|█| 100/100 [00:00<00:00, 622.
AnnData object with n_obs × n_vars = 1373 × 9157
    obs: 'well_id', 'batch_id', 'treatment_id', 'log10_gfp', 'rotated_umap1', 'rotated_umap2', 'som_cluster_id', 'monocle_branch_id', 'monocle_pseudotime', 'exp_type', 'time', 'cell_type', 'nGenes', 'nCounts', 'pMito', 'pass_basic_filter', 'Size_Factor', 'initial_cell_size', 'new_Size_Factor', 'initial_new_cell_size', 'total_Size_Factor', 'initial_total_cell_size', 'ntr', 'cell_cycle_phase', 'control_point_umap_ori', 'inlier_prob_umap_ori', 'obs_vf_angle_umap_ori'
    var: 'ID', 'NAME', 'nCells', 'nCounts', 'pass_basic_filter', 'log_m', 'score', 'log_cv', 'frac', 'use_for_pca', 'ntr', 'alpha', 'beta', 'gamma', 'half_life', 'alpha_b', 'alpha_r2', 'gamma_b', 'gamma_r2', 'gamma_logLL', 'delta_b', 'delta_r2', 'bs', 'bf', 'uu0', 'ul0', 'su0', 'sl0', 'U0', 'S0', 'total0', 'beta_k', 'gamma_k', 'use_for_dynamics', 'use_for_transition'
    uns: 'pp', 'velocyto_SVR', 'PCs', 'explained_variance_ratio_', 'pca_mean', 'pca_fit', 'feature_selection', 'cell_phase_genes', 'dynamics', 'neighbors', 'umap_fit', 'grid_velocity_umap', 'grid_velocity_umap_ori', 'cell_type_colors', 'cell_cycle_phase_colors', 'VecFld_umap_ori', 'fate_umap_ori'
    obsm: 'X_pca', 'X', 'cell_cycle_scores', 'X_umap', 'velocity_umap', 'X_umap_ori', 'velocity_umap_ori', 'velocity_umap_ori_SparseVFC', 'X_umap_ori_SparseVFC'
    varm: 'alpha'
    layers: 'new', 'total', 'X_new', 'X_total', 'M_t', 'M_tt', 'M_n', 'M_tn', 'M_nn', 'velocity_N', 'velocity_T'
    obsp: 'moments_con', 'distances', 'connectivities', 'pearson_transition_matrix'
%%capture
import matplotlib.pyplot as plt

fig, ax = plt.subplots()
ax = dyn.pl.topography(adata, basis='umap_ori', color='cell_type', ax=ax, save_show_or_return='return',  figsize=(24, 24))
ax.set_aspect(0.8)
%%capture
adata.obs['time'] = adata.obs.time.astype('float')
instance = dyn.mv.StreamFuncAnim(adata=adata, basis='umap_ori', color='cell_type', ax=ax)