Preprocessing Tutorial
This tutorial focuses on how to utilize dynamo to preprocess data. In the new version, we make dynamo.pp.Preprocessor class to allow you to freely explore different preprocessing recipes whose step parameters that can be configured inside dynamo.pp.Preprocessor. Existing recipes in preprocessor includes monocle, pearson residual, seurat and sctransform. Moreover, you can replace each preprocessing step with your own implementation with ease. For instance, dynamo.pp.Preprocessor’s monocle pipeline contains dynamo.pp.filter_cells(), dynamo.pp.filter_genes(), dynamo.pp.normalize_cell_expr_by_size_factors(), dynamo.pp.select_genes_by_pearson_residuals() and other steps. You can replace the implementation and default monocle parameters passed in to these functions by replacing or changing attributes of dynamo.pp.Preprocessor.
In older versions, dynamo offer several recipes, among which dynamo.pp.recipe_monocle() is a basic function as a building block of other recipes. You can still use these functions to preprocess data.
dynamo.pp.Preprocessor provides users with dynamo.pp.Preprocessor.config_monocle_recipe() and other config_*_recipes methods to help you reproduce different preprocessor results and integrate with your newly developed preprocessing algorithms.
Import packages
import warnings
warnings.filterwarnings('ignore')
warnings.filterwarnings("ignore", message="numpy.dtype size changed")

import dynamo as dyn

dyn.configuration.set_figure_params('dynamo', background='white')
dyn.pl.style(font_path='Arial')
dyn.get_all_dependencies_version()

%load_ext autoreload
%autoreload 2
Using already downloaded Arial font from: /tmp/dynamo_arial.ttf
Registered custom font as: Arial


 ███                               ████████
█████   █████    █████    █████    ███   █████
   ██████   ██████   ██████   ████████      ████
  ___                           ████            ███
 |   \ _  _ _ _  __ _ _ __  ___                 ███
 | |) | || | ' \/ _` | '  \/ _ \█████           ███
 |___/ \_, |_||_\__,_|_|_|_\___/█████       ████
       |__/                        ███   █████
Tutorial: https://dynamo-release.readthedocs.io/
                                     █████
| package | datacache | Pygments | pynndescent | networkx | openpyxl | seaborn | ipykernel | tqdm | requests | numpy | anndata | numdifftools | matplotlib | colorcet | umap-learn | Sphinx | leidenalg | scikit-learn | statsmodels | mudata | pandas | patsy | get_version | igraph | igraph | adjustText | scipy | loompy | dynamo-release | sphinx-book-theme | setuptools | numba |
|---|---|---|---|---|---|---|---|---|---|---|---|---|---|---|---|---|---|---|---|---|---|---|---|---|---|---|---|---|---|---|---|---|
| version | 1.5.0 | 2.20.0 | 0.6.0 | 3.4.2 | 3.1.5 | 0.13.2 | 6.22.0 | 4.68.2 | 2.34.2 | 2.2.6 | 0.11.4 | 0.9.42 | 3.10.9 | 3.1.0 | 0.5.7 | 8.1.3 | 0.10.2 | 1.7.2 | 0.14.6 | 0.3.1 | 2.3.3 | 1.0.2 | 3.5.5 | 0.11.9 | 0.11.8 | 1.3.0 | 1.15.3 | 3.0.8 | 1.5.3 | 1.1.4 | 80.10.2 | 0.64.0 |
Glossary of keys generated during preprocessing
obs
pass_basic_filter: a list of boolean variables indicating whether cells pass certain basic filters. In monocle recipe, the basic filtering is based on thresholding of expression values.
var
pass_basic_filter: a list of boolean variables indicating whether genes pass certain basic filters. In monocle recipe, the basic filtering is based on thresholding of expression values.use_for_pca: a list of boolean variables used during PCA dimension reduction and following downstream analysis. In many recipes, this key is equivalent to highly variable genes.highly_variable_scores: a list of float number scores indicating how variable each gene is, typically generated during gene feature selection (preprocessor.select_genes). Note only part of recipes do not have this highly variable scores. E.g.seuratV3recipe implemented in dynamo does not have highly variable scores due to its thresholding nature.
layers
X_spliced: unspliced expression matrix after normalization used in downstream computationX_unspliced: spliced expression matrix after normalization used in downstream computation
obsm
X_pca: normalized X after PCA transformation
Using Predefined (default) Recipe Configurations in Preprocessor
Firstly, you can just start with the inclusion of a preprocessor, so that your life can become much easier. With just three lines of code, the preprocessor can handle the entire process of data filtering, manipulation, calculation, and conversion. You no longer have to worry about the headaches associated with these tasks.
adata = dyn.sample_data.zebrafish()
adata
|-----> File ./data/zebrafish.h5ad already exists.
AnnData object with n_obs × n_vars = 4181 × 16940
    obs: 'split_id', 'sample', 'Size_Factor', 'condition', 'Cluster', 'Cell_type', 'umap_1', 'umap_2', 'batch'
    layers: 'spliced', 'unspliced'
Read zebrafish data
adata = dyn.sample_data.zebrafish()
celltype_key = "Cell_type"
|-----> File ./data/zebrafish.h5ad already exists.
Import Preprocessor class
from dynamo.preprocessing import Preprocessor
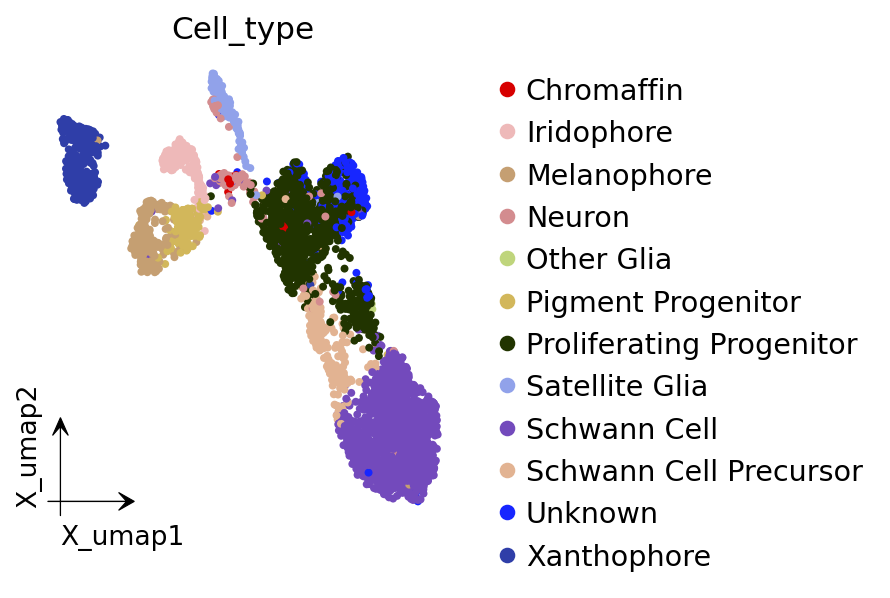
dynamo provides users with dynamo.pp.Preprocessor.preprocess_adata(), a simple wrapper, to apply preprocess steps with default settings. In this section, we will go through recipes in dynamo.pp.Preprocessor.preprocess_adata() and observe how preprocess methods can influence visualization results.
Applying Monocle Recipe
preprocessor = Preprocessor()
preprocessor.preprocess_adata(adata, recipe="monocle")

# Alternative
# preprocessor.config_monocle_recipe(adata)
# preprocessor.preprocess_adata_monocle(adata)

default_preprocessor_monocle_adata = adata # save for usage later
|-----> Running monocle preprocessing pipeline...
|-----------> filtered out 14 outlier cells
|-----------> filtered out 12746 outlier genes
|-----> PCA dimension reduction
|-----> <insert> X_pca to obsm in AnnData Object.
|-----> [Preprocessor-monocle] completed [2.4219s]

╭─ SUMMARY: Preprocessor.preprocess_adata ───────────────────────────╮
│  Duration: 2.4243s                                                 │
│  Shape:    4,181 x 16,940 -> 4,167 x 16,940                        │
│                                                                    │
│  CHANGES DETECTED                                                  │
│  ────────────────                                                  │
│  ● OBS    │ ✚ initial_cell_size (float)                            │
│           │ ✚ initial_spliced_cell_size (int)                      │
│           │ ✚ initial_unspliced_cell_size (int)                    │
│           │ ✚ nCounts (float)                                      │
│           │ ✚ nGenes (int)                                         │
│           │ ✚ ntr (float)                                          │
│           │ ✚ pMito (int)                                          │
│           │ ✚ pass_basic_filter (bool)                             │
│           │ ✚ spliced_Size_Factor (float)                          │
│           │ ✚ unspliced_Size_Factor (float)                        │
│                                                                    │
│  ● VAR    │ ✚ frac (float)                                         │
│           │ ✚ log_cv (float)                                       │
│           │ ✚ log_m (float)                                        │
│           │ ✚ nCells (int)                                         │
│           │ ✚ nCounts (float)                                      │
│           │ ✚ ntr (float)                                          │
│           │ ✚ pass_basic_filter (bool)                             │
│           │ ✚ score (float)                                        │
│           │ ✚ use_for_pca (bool)                                   │
│                                                                    │
│  ● UNS    │ ✚ PCs                                                  │
│           │ ✚ explained_variance_ratio_                            │
│           │ ✚ feature_selection                                    │
│           │ ✚ pca_mean                                             │
│           │ ✚ pp                                                   │
│           │ ✚ velocyto_SVR                                         │
│                                                                    │
│  ● OBSM   │ ✚ X_pca (array, 4167x30)                               │
│                                                                    │
│  ● LAYERS │ ✚ X_spliced (sparse matrix, 4167x16940)                │
│           │ ✚ X_unspliced (sparse matrix, 4167x16940)              │
│                                                                    │
╰────────────────────────────────────────────────────────────────────╯
dyn.tl.reduceDimension(adata, basis="pca")
dyn.pl.umap(adata, color=celltype_key, figsize=(4,4),pointsize=0.05,alpha=1,
           adjust_legend=True,arrow_scale=8,show_legend='upper right')
|-----> retrieve data for non-linear dimension reduction...
|-----> [UMAP] using X_pca with n_pca_components = 30
|-----> <insert> X_umap to obsm in AnnData Object.
|-----> [UMAP] completed [28.8632s]

╭─ SUMMARY: reduceDimension ─────────────────────────────────────────╮
│  Duration: 28.8648s                                                │
│  Shape:    4,167 x 16,940 (Unchanged)                              │
│                                                                    │
│  CHANGES DETECTED                                                  │
│  ────────────────                                                  │
│  ● UNS    │ ✚ neighbors                                            │
│           │ └─ params: {'n_neighbors': 30, 'method': 'umap'}       │
│           │ ✚ umap_fit                                             │
│                                                                    │
│  ● OBSM   │ ✚ X_umap (array, 4167x2)                               │
│                                                                    │
╰────────────────────────────────────────────────────────────────────╯
|-----------> plotting with basis key=X_umap
|-----------> skip filtering Cell_type by stack threshold when stacking color because it is not a numeric type
Applying Pearson Residuals Recipe
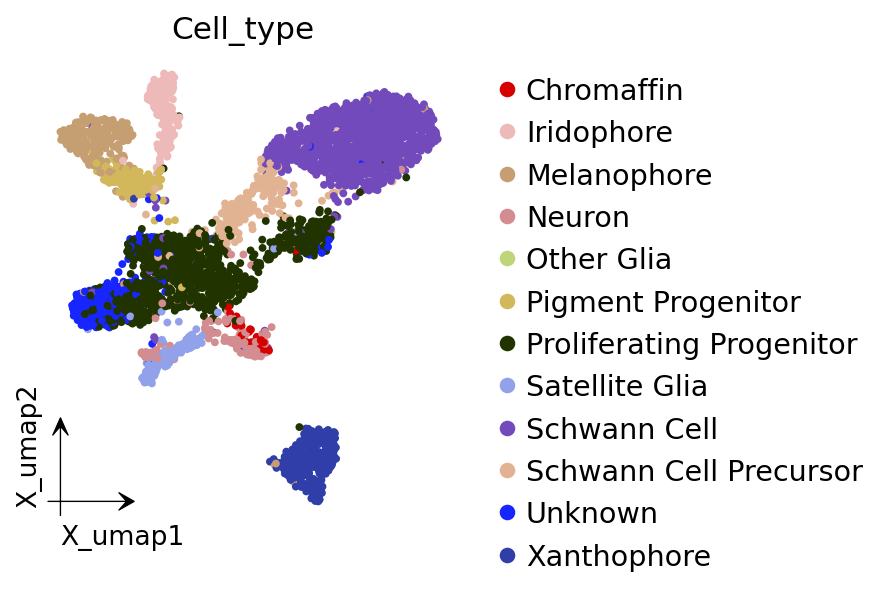
Please note that pearson residual or sctransform transformation should only be performed for adata.X and not applied to different layers. This is because RNA velocity do have physical meanings, and otherwise spliced/unspliced data will reseult in negative values after transformation.
adata = dyn.sample_data.zebrafish()
preprocessor = Preprocessor()
# preprocessor.config_pearson_residuals_recipe(adata)
# preprocessor.preprocess_adata_pearson_residuals(adata)
preprocessor.preprocess_adata(adata, recipe="pearson_residuals")
|-----> File ./data/zebrafish.h5ad already exists.
|-----> gene selection on layer: X
|-----> extracting highly variable genes
|-----------> filtered out 350 outlier genes
|-----> applying Pearson residuals to layer <X>
|-----> replacing layer <X> with pearson residual normalized data.
|-----> [pearson residual normalization for X] completed [0.9291s]
|-----> PCA dimension reduction
|-----> <insert> X_pca to obsm in AnnData Object.
|-----> [Preprocessor-pearson residual] completed [5.4972s]

╭─ SUMMARY: Preprocessor.preprocess_adata ───────────────────────────╮
│  Duration: 5.4988s                                                 │
│  Shape:    4,181 x 16,940 (Unchanged)                              │
│                                                                    │
│  CHANGES DETECTED                                                  │
│  ────────────────                                                  │
│  ● OBS    │ ✚ nCounts (float)                                      │
│           │ ✚ nGenes (int)                                         │
│           │ ✚ pMito (int)                                          │
│           │ ✚ pass_basic_filter (bool)                             │
│                                                                    │
│  ● VAR    │ ✚ gene_highly_variable (bool)                          │
│           │ ✚ highly_variable_rank (float)                         │
│           │ ✚ means (float)                                        │
│           │ ✚ nCells (int)                                         │
│           │ ✚ nCounts (float)                                      │
│           │ ✚ residual_variances (float)                           │
│           │ ✚ use_for_pca (bool)                                   │
│           │ ✚ variances (float)                                    │
│                                                                    │
│  ● UNS    │ ✚ PCs                                                  │
│           │ ✚ explained_variance_ratio_                            │
│           │ ✚ pca_mean                                             │
│           │ ✚ pp                                                   │
│                                                                    │
│  ● OBSM   │ ✚ X_pca (array, 4181x50)                               │
│                                                                    │
╰────────────────────────────────────────────────────────────────────╯
dyn.tl.reduceDimension(adata)
dyn.pl.umap(adata, color=celltype_key, figsize=(4,4),pointsize=0.05,alpha=1,
           adjust_legend=True,arrow_scale=8,show_legend='upper right')
|-----> retrieve data for non-linear dimension reduction...
|-----> [UMAP] using X_pca with n_pca_components = 30
|-----> <insert> X_umap to obsm in AnnData Object.
|-----> [UMAP] completed [45.5593s]

╭─ SUMMARY: reduceDimension ─────────────────────────────────────────╮
│  Duration: 45.5607s                                                │
│  Shape:    4,181 x 16,940 (Unchanged)                              │
│                                                                    │
│  CHANGES DETECTED                                                  │
│  ────────────────                                                  │
│  ● UNS    │ ✚ neighbors                                            │
│           │ └─ params: {'n_neighbors': 30, 'method': 'umap'}       │
│           │ ✚ umap_fit                                             │
│                                                                    │
│  ● OBSM   │ ✚ X_umap (array, 4181x2)                               │
│                                                                    │
╰────────────────────────────────────────────────────────────────────╯
|-----------> plotting with basis key=X_umap
|-----------> skip filtering Cell_type by stack threshold when stacking color because it is not a numeric type
Applying Sctransform Recipe
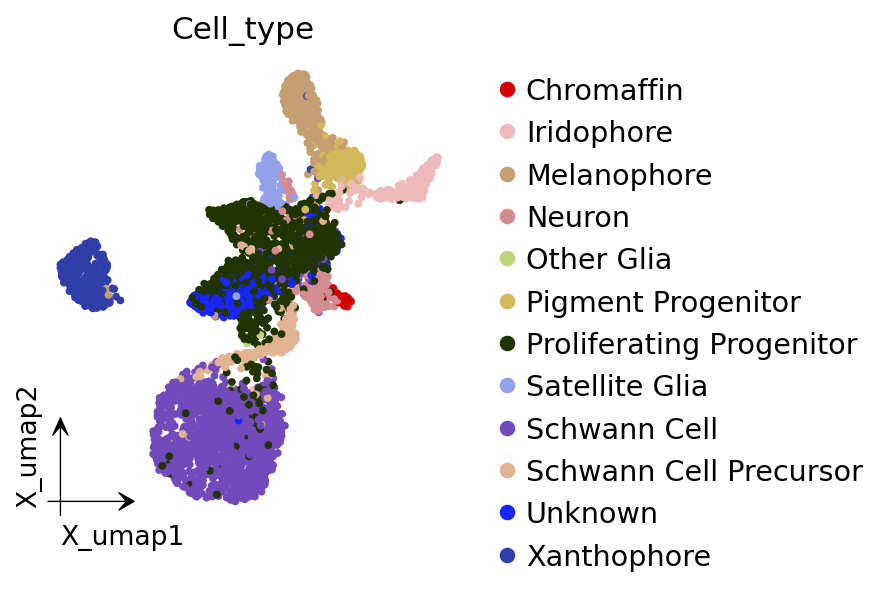
Here, you need to install the KDEpy before to run sctransform. you can use pip install KDEpy to install it.
Sctransform transformation is only applied to adata.X and not applied to different layers, as stated above.
adata = dyn.sample_data.zebrafish()
preprocessor = Preprocessor()
# preprocessor.config_sctransform_recipe(adata)
# preprocessor.preprocess_adata_sctransform(adata)
preprocessor.preprocess_adata(adata, recipe="sctransform")
|-----> File ./data/zebrafish.h5ad already exists.
|-----> Running Sctransform recipe preprocessing...
|-----------> filtered out 14 outlier cells
|-----------> filtered out 12410 outlier genes
|-----? Sctransform recipe will subset the data first with default gene selection function for efficiency. If you want to disable this, please perform sctransform without recipe.
|-----> sctransform adata on layer: X
|-----------> set sctransform results to adata.X
|-----> PCA dimension reduction
|-----> <insert> X_pca to obsm in AnnData Object.
|-----> [Preprocessor-sctransform] completed [33.6224s]

╭─ SUMMARY: Preprocessor.preprocess_adata ───────────────────────────╮
│  Duration: 33.6239s                                                │
│  Shape:    4,181 x 16,940 -> 4,167 x 3,000                         │
│                                                                    │
│  CHANGES DETECTED                                                  │
│  ────────────────                                                  │
│  ● OBS    │ ✚ gene_sct (float)                                     │
│           │ ✚ initial_cell_size (float)                            │
│           │ ✚ initial_spliced_cell_size (int)                      │
│           │ ✚ initial_unspliced_cell_size (int)                    │
│           │ ✚ log_gene_sct (float)                                 │
│           │ ✚ log_umi_per_gene_sct (float)                         │
│           │ ✚ log_umi_sct (float)                                  │
│           │ ✚ nCounts (float)                                      │
│           │ ✚ nGenes (int)                                         │
│           │ ✚ pMito (int)                                          │
│           │ ✚ pass_basic_filter (bool)                             │
│           │ ✚ spliced_Size_Factor (float)                          │
│           │ ✚ umi_per_gene_sct (float)                             │
│           │ ✚ umi_sct (float)                                      │
│           │ ✚ unspliced_Size_Factor (float)                        │
│                                                                    │
│  ● VAR    │ ✚ Intercept_sct (float)                                │
│           │ ✚ Intercept_step1_sct (float)                          │
│           │ ✚ dispersion_step1_sct (float)                         │
│           │ ✚ frac (float)                                         │
│           │ ✚ genes_step1_sct (int)                                │
│           │ ✚ log10_gmean_sct (float)                              │
│           │ ✚ log_cv (float)                                       │
│           │ ✚ log_m (float)                                        │
│           │ ✚ log_umi_sct (float)                                  │
│           │ ✚ log_umi_step1_sct (float)                            │
│           │ ✚ model_pars_theta_step1 (float)                       │
│           │ ✚ nCells (int)                                         │
│           │ ✚ nCounts (float)                                      │
│           │ ✚ pass_basic_filter (bool)                             │
│           │ ✚ score (float)                                        │
│           │ ✚ sct_score (float)                                    │
│           │ ✚ theta_sct (float)                                    │
│           │ ✚ use_for_pca (bool)                                   │
│                                                                    │
│  ● UNS    │ ✚ PCs                                                  │
│           │ ✚ explained_variance_ratio_                            │
│           │ ✚ feature_selection                                    │
│           │ ✚ pca_mean                                             │
│           │ ✚ pp                                                   │
│           │ ✚ velocyto_SVR                                         │
│                                                                    │
│  ● OBSM   │ ✚ X_pca (array, 4167x50)                               │
│                                                                    │
│  ● LAYERS │ ✚ X_spliced (sparse matrix, 4167x3000)                 │
│           │ ✚ X_unspliced (sparse matrix, 4167x3000)               │
│                                                                    │
╰────────────────────────────────────────────────────────────────────╯
dyn.tl.reduceDimension(adata)
dyn.pl.umap(adata, color=celltype_key, figsize=(4,4),pointsize=0.05,alpha=1,
           adjust_legend=True,arrow_scale=8)
|-----> retrieve data for non-linear dimension reduction...
|-----> [UMAP] using X_pca with n_pca_components = 30
|-----> <insert> X_umap to obsm in AnnData Object.
|-----> [UMAP] completed [31.9513s]

╭─ SUMMARY: reduceDimension ─────────────────────────────────────────╮
│  Duration: 31.9533s                                                │
│  Shape:    4,167 x 3,000 (Unchanged)                               │
│                                                                    │
│  CHANGES DETECTED                                                  │
│  ────────────────                                                  │
│  ● UNS    │ ✚ neighbors                                            │
│           │ └─ params: {'n_neighbors': 30, 'method': 'umap'}       │
│           │ ✚ umap_fit                                             │
│                                                                    │
│  ● OBSM   │ ✚ X_umap (array, 4167x2)                               │
│                                                                    │
╰────────────────────────────────────────────────────────────────────╯
|-----------> plotting with basis key=X_umap
|-----------> skip filtering Cell_type by stack threshold when stacking color because it is not a numeric type
Applying Seurat Recipe
adata = dyn.sample_data.zebrafish()
preprocessor = Preprocessor()
# preprocessor.config_seurat_recipe()
# preprocessor.preprocess_adata_seurat(adata)
preprocessor.preprocess_adata(adata, recipe="seurat")
|-----> File ./data/zebrafish.h5ad already exists.
|-----> Running Seurat recipe preprocessing...
|-----------> filtered out 14 outlier cells
|-----------> filtered out 11388 outlier genes
|-----> select genes on var key: pass_basic_filter
|-----------> choose 2000 top genes
|-----> number of selected highly variable genes: 2000
|-----> PCA dimension reduction
|-----> <insert> X_pca to obsm in AnnData Object.
|-----> [Preprocessor-seurat] completed [1.1519s]

╭─ SUMMARY: Preprocessor.preprocess_adata ───────────────────────────╮
│  Duration: 1.1534s                                                 │
│  Shape:    4,181 x 16,940 -> 4,167 x 16,940                        │
│                                                                    │
│  CHANGES DETECTED                                                  │
│  ────────────────                                                  │
│  ● OBS    │ ✚ initial_cell_size (float)                            │
│           │ ✚ initial_spliced_cell_size (int)                      │
│           │ ✚ initial_unspliced_cell_size (int)                    │
│           │ ✚ nCounts (float)                                      │
│           │ ✚ nGenes (int)                                         │
│           │ ✚ pMito (int)                                          │
│           │ ✚ pass_basic_filter (bool)                             │
│           │ ✚ spliced_Size_Factor (float)                          │
│           │ ✚ unspliced_Size_Factor (float)                        │
│                                                                    │
│  ● VAR    │ ✚ gene_highly_variable (bool)                          │
│           │ ✚ nCells (int)                                         │
│           │ ✚ nCounts (float)                                      │
│           │ ✚ pass_basic_filter (bool)                             │
│           │ ✚ pp_gene_mean (float)                                 │
│           │ ✚ pp_gene_variance (float)                             │
│           │ ✚ use_for_pca (bool)                                   │
│                                                                    │
│  ● UNS    │ ✚ PCs                                                  │
│           │ ✚ explained_variance_ratio_                            │
│           │ ✚ pca_mean                                             │
│           │ ✚ pp                                                   │
│                                                                    │
│  ● OBSM   │ ✚ X_pca (array, 4167x30)                               │
│                                                                    │
│  ● LAYERS │ ✚ X_spliced (sparse matrix, 4167x16940)                │
│           │ ✚ X_unspliced (sparse matrix, 4167x16940)              │
│                                                                    │
╰────────────────────────────────────────────────────────────────────╯
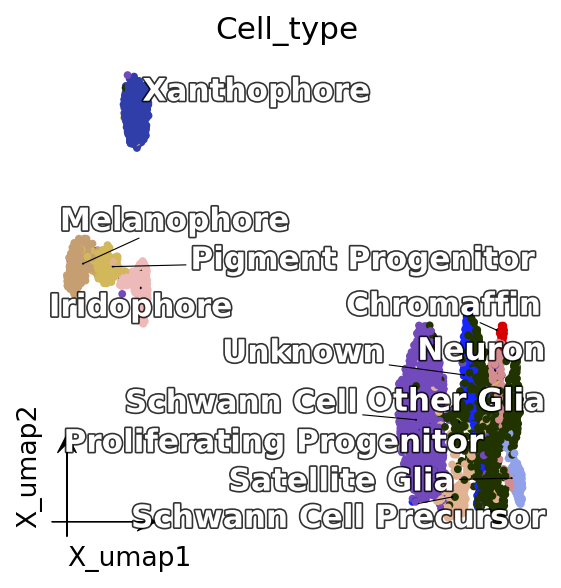
dyn.tl.reduceDimension(adata)
dyn.pl.umap(adata, color=celltype_key, figsize=(4,4),pointsize=0.05,alpha=1,
           adjust_legend=True,arrow_scale=8)
|-----> retrieve data for non-linear dimension reduction...
|-----> [UMAP] using X_pca with n_pca_components = 30
|-----> <insert> X_umap to obsm in AnnData Object.
|-----> [UMAP] completed [11.3506s]

╭─ SUMMARY: reduceDimension ─────────────────────────────────────────╮
│  Duration: 11.352s                                                 │
│  Shape:    4,167 x 16,940 (Unchanged)                              │
│                                                                    │
│  CHANGES DETECTED                                                  │
│  ────────────────                                                  │
│  ● UNS    │ ✚ neighbors                                            │
│           │ └─ params: {'n_neighbors': 30, 'method': 'umap'}       │
│           │ ✚ umap_fit                                             │
│                                                                    │
│  ● OBSM   │ ✚ X_umap (array, 4167x2)                               │
│                                                                    │
╰────────────────────────────────────────────────────────────────────╯
|-----------> plotting with basis key=X_umap
|-----------> skip filtering Cell_type by stack threshold when stacking color because it is not a numeric type
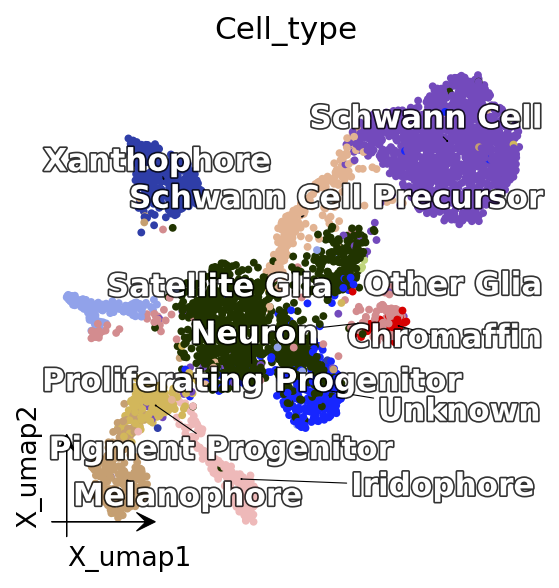
Applying PFlog1pPF Recipe
The pflog1ppf recipe implements the depth-normalization method of Booeshaghi, Hjörleifsson, Gehring & Pachter (2022, BHGP_2022): proportional fitting (PF) → log1p → proportional fitting (PF). The first PF places every cell at a common sequencing depth, log1p stabilizes the variance, and the second PF removes the residual depth dependence that log1p reintroduces. As with the other transforms, PFlog1pPF is applied only to adata.X; the spliced/unspliced layers keep the standard size-factor normalization so that downstream RNA velocity remains valid. Because PF is a per-cell rescaling and log1p preserves zeros, the normalized matrix stays sparse.
adata = dyn.sample_data.zebrafish()
preprocessor = Preprocessor()
# preprocessor.config_pflog1ppf_recipe(adata)
# preprocessor.preprocess_adata_pflog1ppf(adata)
preprocessor.preprocess_adata(adata, recipe="pflog1ppf")
|-----> File ./data/zebrafish.h5ad already exists.
|-----> Running PFlog1pPF preprocessing pipeline...
|-----------> filtered out 14 outlier cells
|-----------> filtered out 12746 outlier genes
|-----> PCA dimension reduction
|-----> <insert> X_pca to obsm in AnnData Object.
|-----> [Preprocessor-pflog1ppf] completed [31.1516s]

╭─ SUMMARY: Preprocessor.preprocess_adata ───────────────────────────╮
│  Duration: 31.1539s                                                │
│  Shape:    4,181 x 16,940 -> 4,167 x 16,940                        │
│                                                                    │
│  CHANGES DETECTED                                                  │
│  ────────────────                                                  │
│  ● OBS    │ ✚ initial_cell_size (float)                            │
│           │ ✚ initial_spliced_cell_size (int)                      │
│           │ ✚ initial_unspliced_cell_size (int)                    │
│           │ ✚ nCounts (float)                                      │
│           │ ✚ nGenes (int)                                         │
│           │ ✚ ntr (float)                                          │
│           │ ✚ pMito (int)                                          │
│           │ ✚ pass_basic_filter (bool)                             │
│           │ ✚ spliced_Size_Factor (float)                          │
│           │ ✚ unspliced_Size_Factor (float)                        │
│                                                                    │
│  ● VAR    │ ✚ frac (float)                                         │
│           │ ✚ log_cv (float)                                       │
│           │ ✚ log_m (float)                                        │
│           │ ✚ nCells (int)                                         │
│           │ ✚ nCounts (float)                                      │
│           │ ✚ ntr (float)                                          │
│           │ ✚ pass_basic_filter (bool)                             │
│           │ ✚ score (float)                                        │
│           │ ✚ use_for_pca (bool)                                   │
│                                                                    │
│  ● UNS    │ ✚ PCs                                                  │
│           │ ✚ explained_variance_ratio_                            │
│           │ ✚ feature_selection                                    │
│           │ ✚ pca_mean                                             │
│           │ ✚ pp                                                   │
│           │ ✚ velocyto_SVR                                         │
│                                                                    │
│  ● OBSM   │ ✚ X_pca (array, 4167x30)                               │
│                                                                    │
│  ● LAYERS │ ✚ X_spliced (sparse matrix, 4167x16940)                │
│           │ ✚ X_unspliced (sparse matrix, 4167x16940)              │
│                                                                    │
╰────────────────────────────────────────────────────────────────────╯
dyn.tl.reduceDimension(adata)
dyn.pl.umap(adata, color=celltype_key, figsize=(4,4),pointsize=0.05,alpha=1,
           adjust_legend=True,arrow_scale=8)
|-----> retrieve data for non-linear dimension reduction...
|-----> [UMAP] using X_pca with n_pca_components = 30
|-----> <insert> X_umap to obsm in AnnData Object.
|-----> [UMAP] completed [11.4631s]

╭─ SUMMARY: reduceDimension ─────────────────────────────────────────╮
│  Duration: 11.4647s                                                │
│  Shape:    4,167 x 16,940 (Unchanged)                              │
│                                                                    │
│  CHANGES DETECTED                                                  │
│  ────────────────                                                  │
│  ● UNS    │ ✚ neighbors                                            │
│           │ └─ params: {'n_neighbors': 30, 'method': 'umap'}       │
│           │ ✚ umap_fit                                             │
│                                                                    │
│  ● OBSM   │ ✚ X_umap (array, 4167x2)                               │
│                                                                    │
╰────────────────────────────────────────────────────────────────────╯
|-----------> plotting with basis key=X_umap
|-----------> skip filtering Cell_type by stack threshold when stacking color because it is not a numeric type
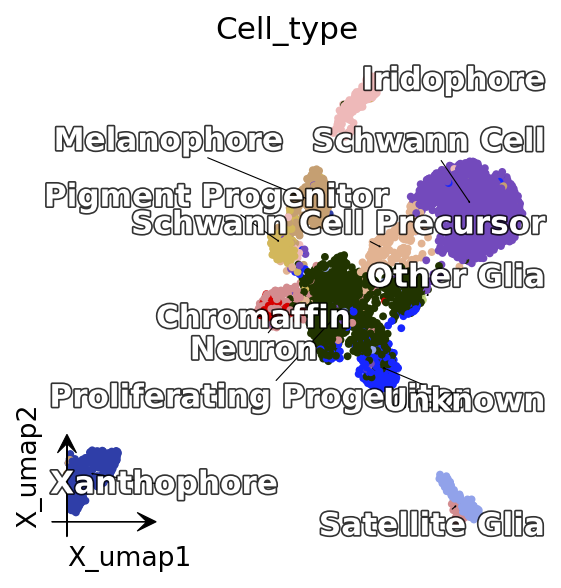
Customize Function Parameters Configured in Preprocessor
Here we are gong to use recipe monocle as an example. In recipe monocle’s selection genes function, we can set recipe to be dynamo_monocle, seurat, svr and others to apply different criterions to select genes. We can set preprocesor’s select_genes_kwargs to pass wanted parameters. In the example below, the default parameter is recipe=dynmoa_monocle. We can change it to seurat and add other contraint parameters as well.
Let’s call dynamo.pp.Preprocessor.config_monocle_recipe() to set monocle recipe preprocessing steps and corresponding function parameters. The default constructor parameters of dynamo.pp.Preprocessor for preprocessing are from our monocle recipe used in dynamo papers.
adata = dyn.sample_data.zebrafish()
preprocessor = Preprocessor()
preprocessor.config_monocle_recipe(adata)
|-----> File ./data/zebrafish.h5ad already exists.
preprocessor.select_genes_kwargs contains arguments that will be passed to dynamo.pp.Preprocessor.select_genes() step.
preprocessor.select_genes_kwargs
{'n_top_genes': 2000, 'SVRs_kwargs': {'relative_expr': False}}
To set the preprocessing steps and their corresponding function parameters for the monocle recipe, we can call dynamo.pp.Preprocessor.config_monocle_recipe(). By default, the constructor parameters of the Preprocessor for preprocessing are set to the monocle recipe used in report the Dynamo cell paper dynamo.
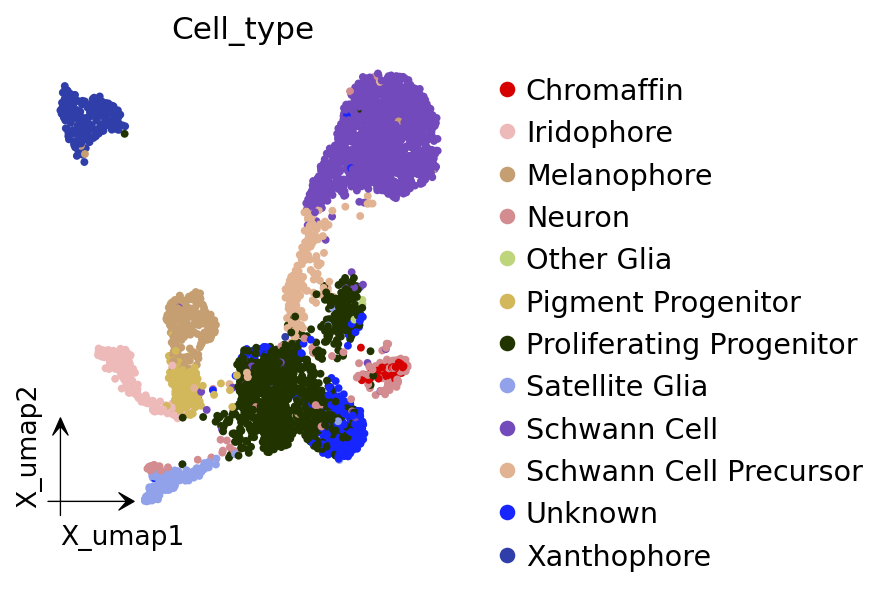
If you would like to customize the dataset to better fit your preferences, you can adjust the parameters before running the recipe. Here is an example.
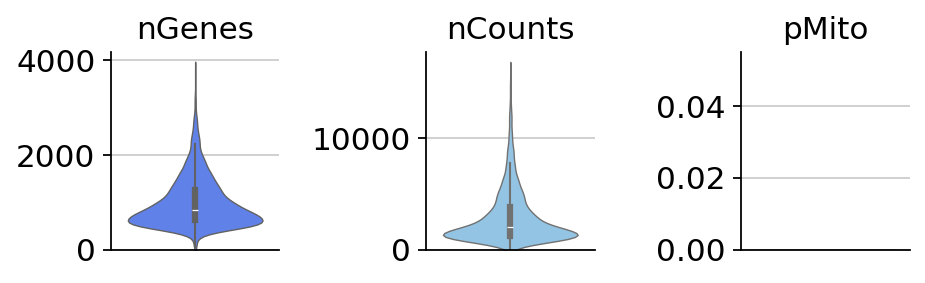
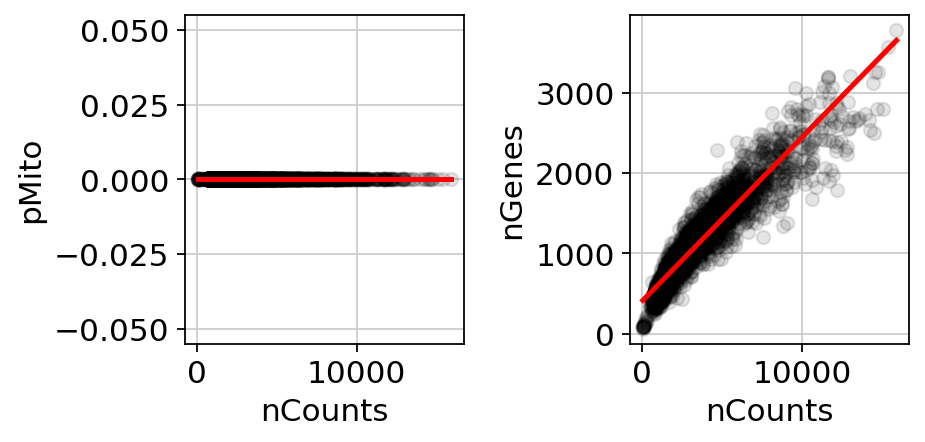
To begin, you can create a plot of the basic statistics (nGenes, nCounts, and pMito) for each category of adata. - nGenes: the number of genes - nCounts: the number of cells - pMito: the percentage of mitochondria genes.
dyn.pl.basic_stats(adata, figsize=(2, 2))
You can visualize the rank of the fraction of UMI to the total UMI per cell for the top 20 genes
dyn.pl.highest_frac_genes(adata, figsize=(10, 2))
|-----------? use_for_pca not in adata.var, ignoring the gene annotation key when plotting
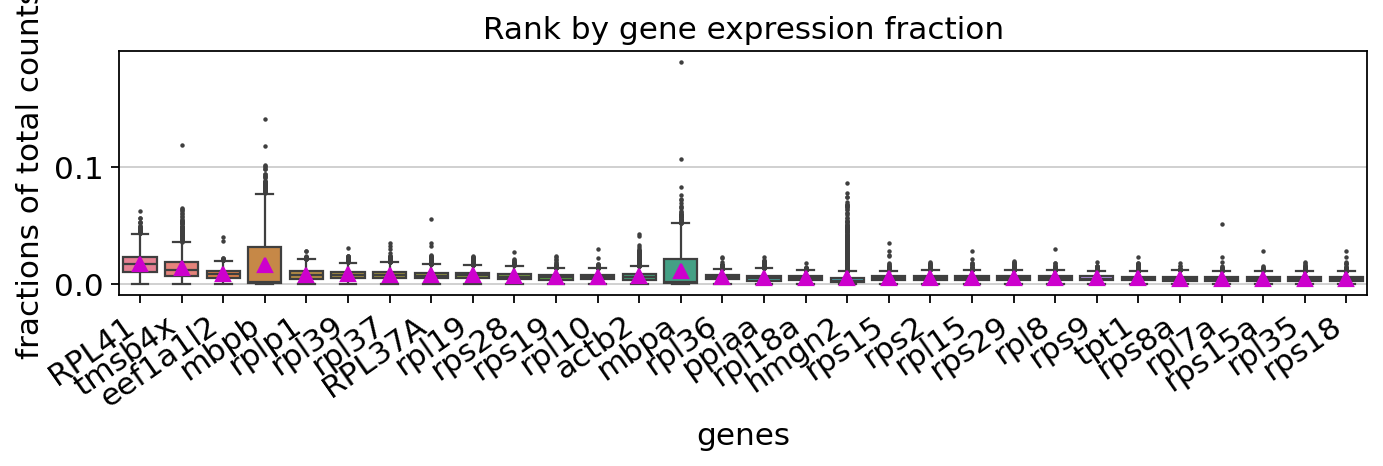
<Axes: title={'center': 'Rank by gene expression fraction'}, xlabel='genes', ylabel='fractions of total counts'>
You can get rid of any cells that have mitochondrial gene expression percentage greater than pMito or total counts greater than nCounts. You can adjust the threshold values as per your requirements.
Note that in our particular case, our data doesn’t have mitochondria counts.
import seaborn as sns
import matplotlib.pyplot as plt

# Create the first figure
df = adata.obs.loc[:, ["nCounts", "pMito", "nGenes"]]
fig, (ax1, ax2) = plt.subplots(1, 2, figsize=(6, 3))  # Adjust the figsize as desired

sns.regplot(data=df,
            x="nCounts",
            y="pMito",
            ax=ax1,
            scatter_kws={"color": "black",  "alpha": 0.1},
            line_kws={"color": "red"})
ax1.set_xlabel("nCounts")
ax1.set_ylabel("pMito")

# Create the second figure
sns.regplot(data=df,
            x="nCounts",
            y="nGenes",
            ax=ax2,
            scatter_kws={"color": "black",  "alpha": 0.1},
            line_kws={"color": "red"})
ax2.set_xlabel("nCounts")
ax2.set_ylabel("nGenes")

# Display the figures side by side
plt.tight_layout()  # Optional: Adjusts spacing between subplots
And modify some values of parameters based on the information above.
import numpy as np
preprocessor.filter_cells_by_outliers_kwargs = {
    "filter_bool": None,
    "layer": "all",
    "min_expr_genes_s": 300,
    "min_expr_genes_u": 100,
    "min_expr_genes_p": 50,
    "max_expr_genes_s": np.inf,
    "max_expr_genes_u": np.inf,
    "max_expr_genes_p": np.inf,
    "shared_count": None,
}
preprocessor.filter_genes_by_outliers_kwargs = {
    "filter_bool": None,
    "layer": "all",
    "min_cell_s": 3,
    "min_cell_u": 2,
    "min_cell_p": 1,
    "min_avg_exp_s": 0,
    "min_avg_exp_u": 0,
    "min_avg_exp_p": 0,
    "max_avg_exp": np.inf,
    "min_count_s": 5,
    "min_count_u": 0,
    "min_count_p": 0,
    "shared_count": 40,
}
preprocessor.select_genes_kwargs = {
    "n_top_genes": 2500,
    "sort_by": "cv_dispersion",
    "keep_filtered": True,
    "SVRs_kwargs": {
        "relative_expr": True,
        "total_szfactor": "total_Size_Factor",
        "min_expr_cells": 0,
        "min_expr_avg": 0,
        "max_expr_avg": np.inf,
        "winsorize": False,
        "winsor_perc": (1, 99.5),
        "sort_inverse": False,
        "svr_gamma": None,
    },
}
preprocessor.preprocess_adata_monocle(adata);
dyn.tl.reduceDimension(adata)
dyn.pl.umap(adata, color=celltype_key, figsize=(4,4),pointsize=0.05,alpha=1,
           adjust_legend=True,arrow_scale=8,show_legend='upper right')
|-----> Running monocle preprocessing pipeline...
|-----------> filtered out 125 outlier cells
|-----------> filtered out 13035 outlier genes
|-----> PCA dimension reduction
|-----> <insert> X_pca to obsm in AnnData Object.
|-----> [Preprocessor-monocle] completed [2.0773s]
|-----> retrieve data for non-linear dimension reduction...
|-----> [UMAP] using X_pca with n_pca_components = 30
|-----> <insert> X_umap to obsm in AnnData Object.
|-----> [UMAP] completed [24.1019s]

╭─ SUMMARY: reduceDimension ─────────────────────────────────────────╮
│  Duration: 24.1034s                                                │
│  Shape:    4,056 x 16,940 (Unchanged)                              │
│                                                                    │
│  CHANGES DETECTED                                                  │
│  ────────────────                                                  │
│  ● UNS    │ ✚ neighbors                                            │
│           │ └─ params: {'n_neighbors': 30, 'method': 'umap'}       │
│           │ ✚ umap_fit                                             │
│                                                                    │
│  ● OBSM   │ ✚ X_umap (array, 4056x2)                               │
│                                                                    │
╰────────────────────────────────────────────────────────────────────╯
|-----------> plotting with basis key=X_umap
|-----------> skip filtering Cell_type by stack threshold when stacking color because it is not a numeric type
Customize and run each functions directly.
We understand that some of you may prefer to use the each function by calling your own customized parameters. To cater to these needs, we have prepared the following guidances help you utilizing the conventional steps with our new preprocessor class. This way, you can still take advantage of the benefits of the preprocessor while also incorporating your own specific requirements.
pp = Preprocessor()
adata = dyn.sample_data.zebrafish()
pp.standardize_adata(adata, 'time', None)
|-----> File ./data/zebrafish.h5ad already exists.
pp.filter_cells_by_outliers(adata, max_expr_genes_s=2000)
|-----------> filtered out 244 outlier cells
AnnData object with n_obs × n_vars = 3937 × 16940
    obs: 'split_id', 'sample', 'Size_Factor', 'condition', 'Cluster', 'Cell_type', 'umap_1', 'umap_2', 'batch', 'nGenes', 'nCounts', 'pMito', 'pass_basic_filter'
    var: 'nCells', 'nCounts'
    uns: 'pp'
    layers: 'spliced', 'unspliced'
pp.filter_genes_by_outliers(adata, max_avg_exp=2000, shared_count=40)
|-----------> filtered out 13890 outlier genes
tmsb4x         True
rpl8           True
ppiaa          True
rpl10a         True
rps4x          True
              ...
cdc42ep1a     False
camk1da       False
zdhhc22       False
zgc:153681    False
mmp16b        False
Name: pass_basic_filter, Length: 16940, dtype: bool
pp.normalize_by_cells(adata)
AnnData object with n_obs × n_vars = 3937 × 16940
    obs: 'split_id', 'sample', 'Size_Factor', 'condition', 'Cluster', 'Cell_type', 'umap_1', 'umap_2', 'batch', 'nGenes', 'nCounts', 'pMito', 'pass_basic_filter', 'spliced_Size_Factor', 'initial_spliced_cell_size', 'initial_cell_size', 'unspliced_Size_Factor', 'initial_unspliced_cell_size'
    var: 'nCells', 'nCounts', 'pass_basic_filter'
    uns: 'pp'
    layers: 'spliced', 'unspliced', 'X_spliced', 'X_unspliced'
pp.select_genes(adata, sort_by="fano_dispersion") # "cv_dispersion" or "gini"
pp.norm_method(adata) # log1p
AnnData object with n_obs × n_vars = 3937 × 16940
    obs: 'split_id', 'sample', 'Size_Factor', 'condition', 'Cluster', 'Cell_type', 'umap_1', 'umap_2', 'batch', 'nGenes', 'nCounts', 'pMito', 'pass_basic_filter', 'spliced_Size_Factor', 'initial_spliced_cell_size', 'initial_cell_size', 'unspliced_Size_Factor', 'initial_unspliced_cell_size'
    var: 'nCells', 'nCounts', 'pass_basic_filter', 'log_cv', 'log_m', 'score', 'frac', 'use_for_pca'
    uns: 'pp', 'velocyto_SVR', 'feature_selection'
    layers: 'spliced', 'unspliced', 'X_spliced', 'X_unspliced'
pp.pca(adata)
|-----> <insert> X_pca to obsm in AnnData Object.
AnnData object with n_obs × n_vars = 3937 × 16940
    obs: 'split_id', 'sample', 'Size_Factor', 'condition', 'Cluster', 'Cell_type', 'umap_1', 'umap_2', 'batch', 'nGenes', 'nCounts', 'pMito', 'pass_basic_filter', 'spliced_Size_Factor', 'initial_spliced_cell_size', 'initial_cell_size', 'unspliced_Size_Factor', 'initial_unspliced_cell_size'
    var: 'nCells', 'nCounts', 'pass_basic_filter', 'log_cv', 'log_m', 'score', 'frac', 'use_for_pca'
    uns: 'pp', 'velocyto_SVR', 'feature_selection', 'PCs', 'explained_variance_ratio_', 'pca_mean'
    obsm: 'X_pca'
    layers: 'spliced', 'unspliced', 'X_spliced', 'X_unspliced'
dyn.tl.reduceDimension(adata,basis='pca')
dyn.pl.umap(adata, color=celltype_key, figsize=(4,4),pointsize=0.05,alpha=1,
           adjust_legend=True,arrow_scale=8,show_legend='upper right')
|-----> retrieve data for non-linear dimension reduction...
|-----> [UMAP] using X_pca with n_pca_components = 30
|-----> <insert> X_umap to obsm in AnnData Object.
|-----> [UMAP] completed [18.8868s]

╭─ SUMMARY: reduceDimension ─────────────────────────────────────────╮
│  Duration: 18.8883s                                                │
│  Shape:    3,937 x 16,940 (Unchanged)                              │
│                                                                    │
│  CHANGES DETECTED                                                  │
│  ────────────────                                                  │
│  ● UNS    │ ✚ neighbors                                            │
│           │ └─ params: {'n_neighbors': 30, 'method': 'umap'}       │
│           │ ✚ umap_fit                                             │
│                                                                    │
│  ● OBSM   │ ✚ X_umap (array, 3937x2)                               │
│                                                                    │
╰────────────────────────────────────────────────────────────────────╯
|-----------> plotting with basis key=X_umap
|-----------> skip filtering Cell_type by stack threshold when stacking color because it is not a numeric type